Introduction
Welcome to Systematic Mode!
Does this ever happen to you — a program gets stuck on your screen, not responding, and no matter what you try, it just won’t close? Then, by instinct — maybe because you’ve heard about it, or seen someone else do it — you open Task Manager, find the program in the list, and end the process. It closes. And from that moment on, Task Manager gets filed away in your memory as a tool for exactly one thing: a kill switch for stuck programs.
If that’s how you think of it, you’re not alone — most Windows users only ever open Task Manager, or even think of it, when something needs to be force-closed. But it’s only one side of Task Manager.
In reality, it has a lot more to offer: a whole set of features that give you real insight into your PC, showing you what’s actually going on behind the scenes while it runs.
So today’s topic is Windows Task Manager. And just like we did with Disk Management in our last lesson — where the goal was never just clicking buttons, but understanding the what and why behind each action — we’ll take the same approach here.
What You’ll Learn
- What Task Manager actually is, how to open it, and how to find your way around its interface
- How to read the Processes tab — what’s really running on your PC, and how to safely close something that’s stuck
- How to understand your PC’s Performance tab — CPU, memory, disk, network, and GPU activity in real time
- How to manage startup apps — what they are and how to control them
- How the Users tab works and what it shows when more than one account is involved
- What App History tracks, and how to read the Details and Services tabs, and what information they’re really giving you
Now, before we get into what Task Manager actually is, there’s a very common mix-up among Windows users worth clearing up first: the belief that Task Manager and Taskbar are the same thing. So that’s exactly where we’ll start.
Task Manager vs. Taskbar
Task Manager and Taskbar sound very similar, but they are two completely different parts of Windows. It’s easy to mix them up, especially if you’re relying on the names alone.
The Taskbar is that long bar sitting at the bottom of your screen (unless you’ve moved it). It’s always there while you’re using Windows — it holds your Start button, the search box, and the system tray with your clock, volume, and network icons. Its whole job is to help you launch and switch between things.
Task Manager, on the other hand, is a completely separate program — one you open only when you need it. Its job isn’t to help you launch apps; it’s to show you what’s currently running on your PC and to give you control over processes, startup items, and more — including the ability to force-close something that’s stuck.
Here’s a quick side-by-side to make the distinction stick:
| Taskbar | Task Manager |
|---|---|
| Part of the Windows desktop interface | Windows system utility |
| Used to access and switch between applications | Used to monitor and manage applications and system activity |
| Shows applications and shortcuts you interact with | Shows processes, resource usage, startup apps, users, and more |
| Mainly part of everyday desktop navigation | Mainly used for monitoring, troubleshooting, and management |
| Always visible on screen | Opened only when needed |
To remember: the Taskbar is something you see constantly and use to open things — the Task Manager is something you open only sometimes, to look inside what’s already running.
Now, let’s get into what Task Manager actually is.
Part 1: What Is Task Manager?
Let’s properly get to know Task Manager itself — what it is, how to open it, and what its window actually looks like the first time you see it.
1.1 Task Manager: A Simple Definition
Task Manager is a built-in Windows utility that lets you monitor and manage what’s currently running on your PC. Think of it as a control room — it shows you what’s active behind the scenes and gives you the ability to act on that information when needed.
At its core, it provides information like which programs and background processes are currently running, how much CPU, memory, disk, and network resources they’re using, what launches automatically when you sign in, and which user accounts are active on the PC.
Windows includes it because, without a tool like this, there would be no easy way for an everyday user to see what their PC is actually doing at any given moment — or to step in when something goes wrong, like a program that’s stopped responding.
1.2 How to Open Task Manager
Windows gives you several ways to open Task Manager, and it’s worth knowing more than one, since not every method is available in every situation.
- Ctrl + Shift + Esc — opens Task Manager directly, with no extra menu in between.
- Ctrl + Alt + Delete — brings up a security screen with Task Manager as one of the options.
- Start/Search menu — type “task manager” and select it from the results.
- Win + X (or right-click the Start button) — opens the Quick Link menu, which includes Task Manager.
- Right-click the taskbar — select Task Manager from the menu that appears. (On some early Windows 11 versions this option was missing. It was later restored.)
- Run command — press Win + R, type
taskmgr, and press Enter.
Note on Above Methods
Ctrl + Shift + Esc,Ctrl + Alt + Delete, and right-clicking the taskbar have all been around for a long time and will feel familiar if you’ve used earlier versions of Windows.- Win + X, on the other hand, is a newer-Windows addition.
- The Run command —
taskmgrworks as a way to open Task Manager across pretty much every version of Windows.
1.3 A Quick Look at the Interface
When you open Task Manager for the first time, you’ll see a navigation area on the left and a larger content area on the right that changes based on whatever you’ve selected.
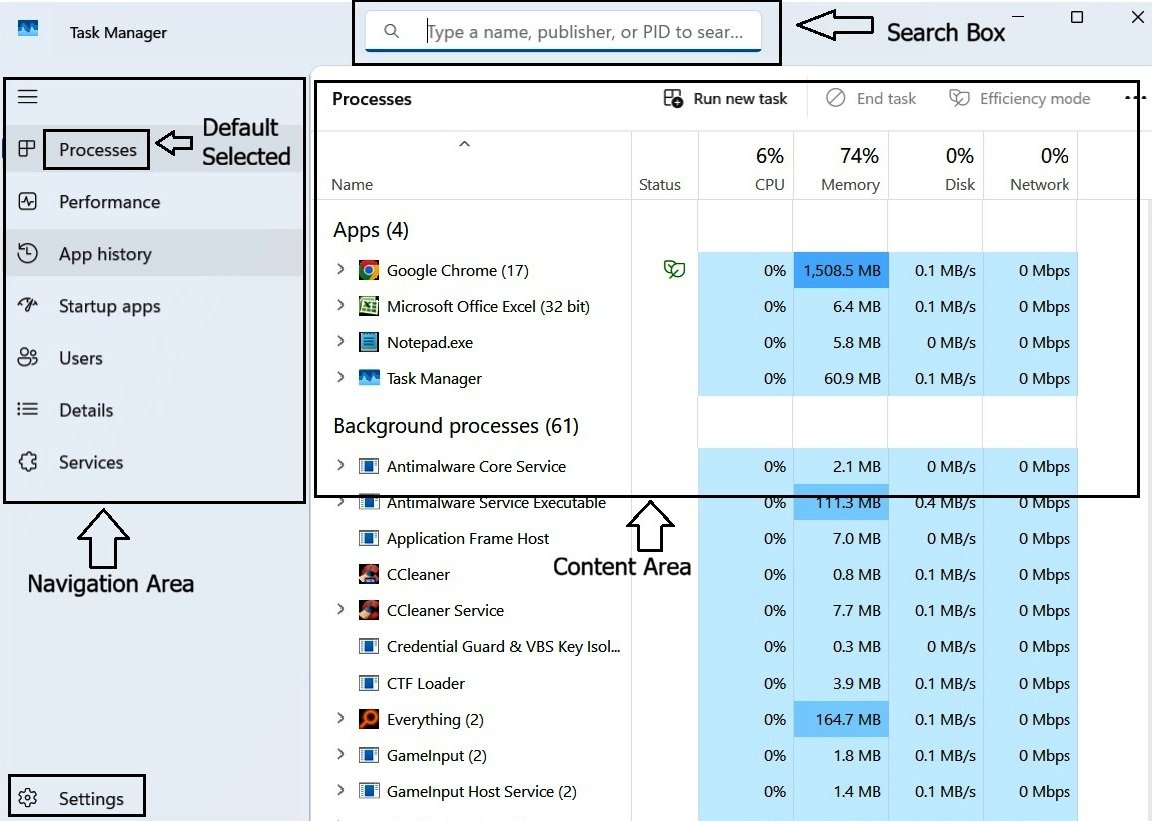
The left side lists seven sections — Processes, Performance, App History, Startup Apps, Users, Details, and Services — along with a Settings option sitting below them. By default, Task Manager opens with Processes selected, so that’s the content you’ll see first.
We won’t be covering these seven sections in the exact order they appear in the sidebar. Four of them — Processes, Performance, Startup Apps, and Users — get the most attention in this lesson, since they’re the ones an everyday user is most likely to actually use. The other three — App History, Details, and Services — we’ll cover in brief, since they lean more technical and aren’t something most people need to touch regularly. Settings, meanwhile, isn’t about your PC’s activity at all — it’s about how Task Manager itself behaves — so we’ll save that for the very end.
Let’s start with the first of our four priority sections: Processes.
Part 2: Understanding Processes in Task Manager
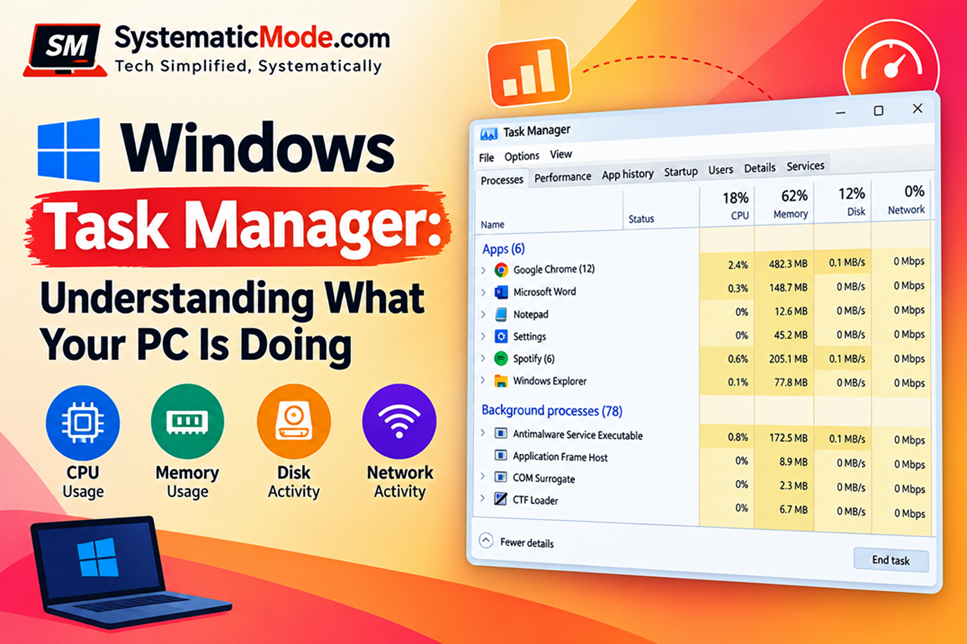
The Processes page is the section most users encounter first when opening Task Manager. It provides a real-time view of the applications, background components, and Windows processes currently running on your computer, along with the resources they are using.
2.1 What Is a Process?
Before exploring the Processes page, it’s important to understand what a process actually is.
A program is a piece of software installed on your computer, such as Notepad, Google Chrome, Microsoft Excel, or Media Player. A process is a running instance of that program. When you open an application, Windows creates one or more processes so that the application can run and perform its tasks.
In addition to the applications you open yourself, Windows also runs many processes in the background to support the operating system, hardware devices, and installed software. Task Manager collects all of these running processes and displays them in a single location.
By default, the Processes page organizes running processes into three categories:
- Apps
- Background Processes
- Windows Processes
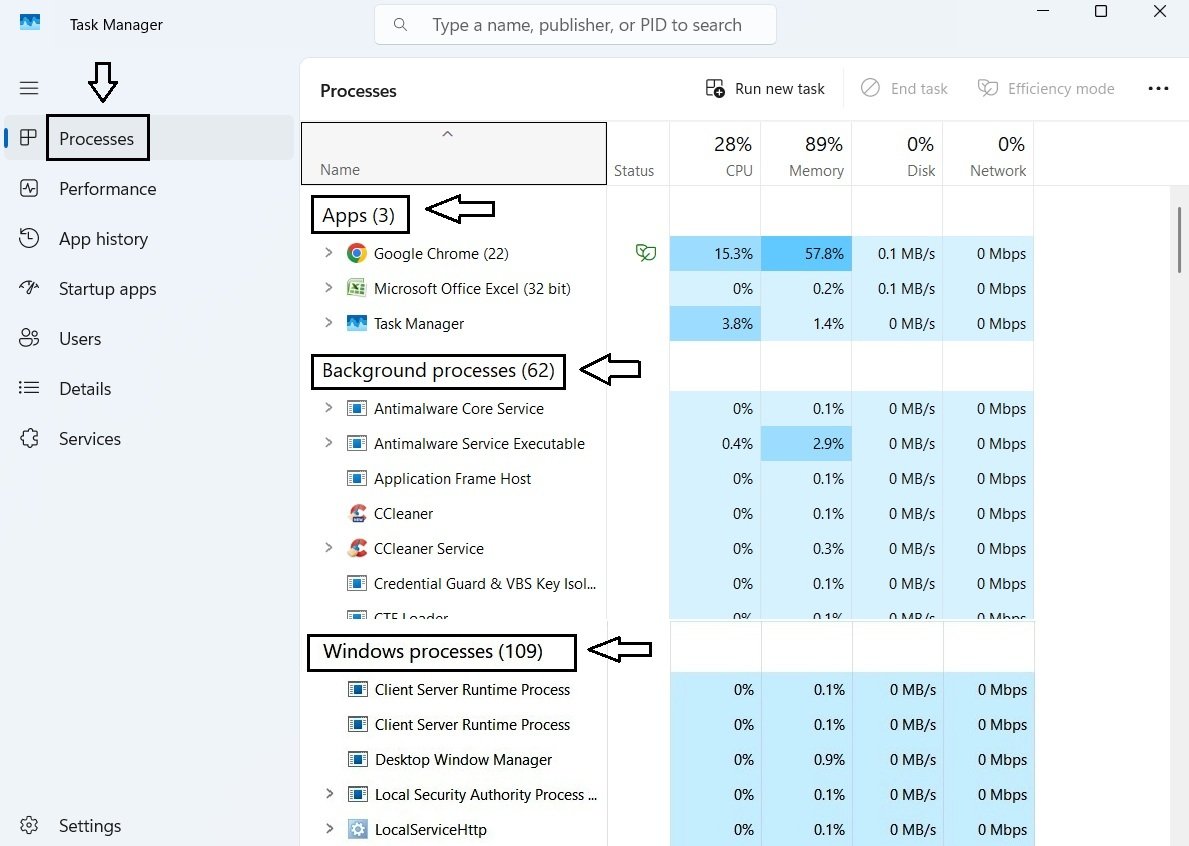
Let’s briefly understand these categories, starting from the bottom.
Windows Processes are processes that belong to Windows itself. These processes help the operating system function correctly and support features such as the desktop, taskbar, networking, updates, security, and other core components.
Background Processes are processes that run behind the scenes without necessarily displaying a visible window. These may belong to installed software, drivers, utilities, cloud-sync applications, antivirus software, and various helper components.
Apps are the applications that you actively open and interact with. Most everyday users spend the majority of their time working with processes in this category.
Note: Seeing dozens or even hundreds of running processes is completely normal in modern versions of Windows. Many applications and Windows components rely on background processes to function properly.
Since most users primarily work with applications, let’s look at the Apps category in more detail.
2.2 App Processes
The Apps section typically displays applications that have been started by the user and are currently running on the computer.
For example, if you open Notepad, Media Player, Microsoft Excel, a web browser, or other applications, they will usually appear in the Apps section of the Processes page.
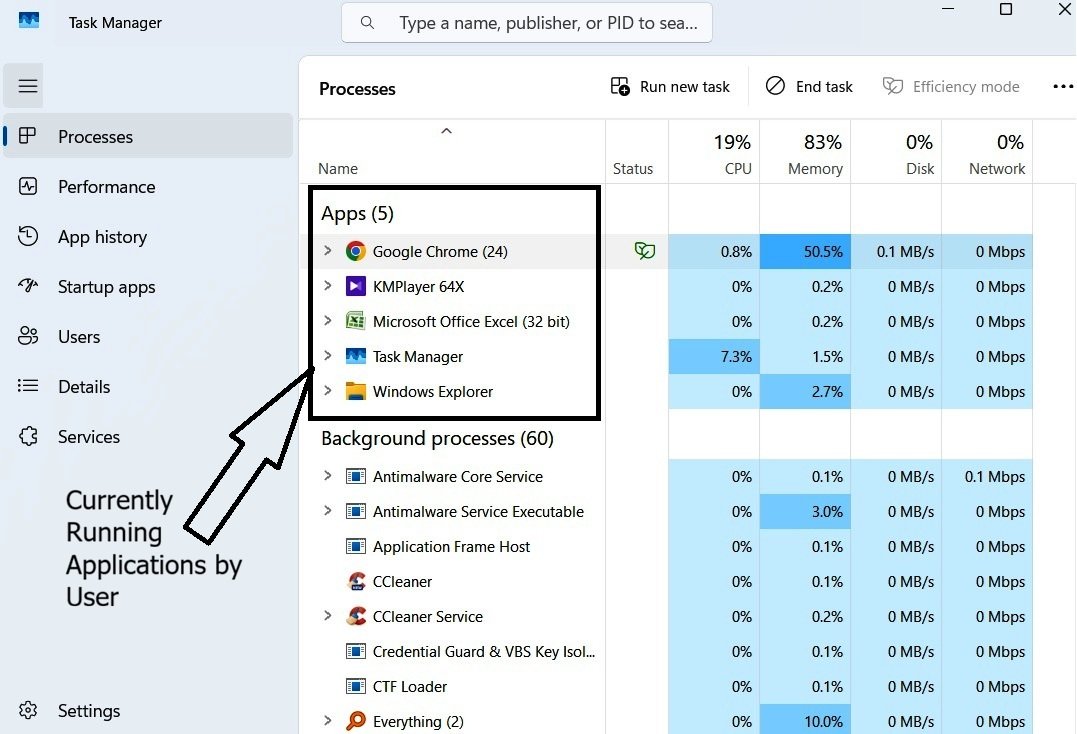
As shown in the screenshot, Task Manager displays the applications that are currently running and allows you to monitor and manage them from a single location.
Grouping Multiple Processes
When you start working with the Apps section, you’ll quickly notice that Task Manager does not always display applications in the same way.
In many cases, multiple windows belonging to the same application are grouped together under a single entry.
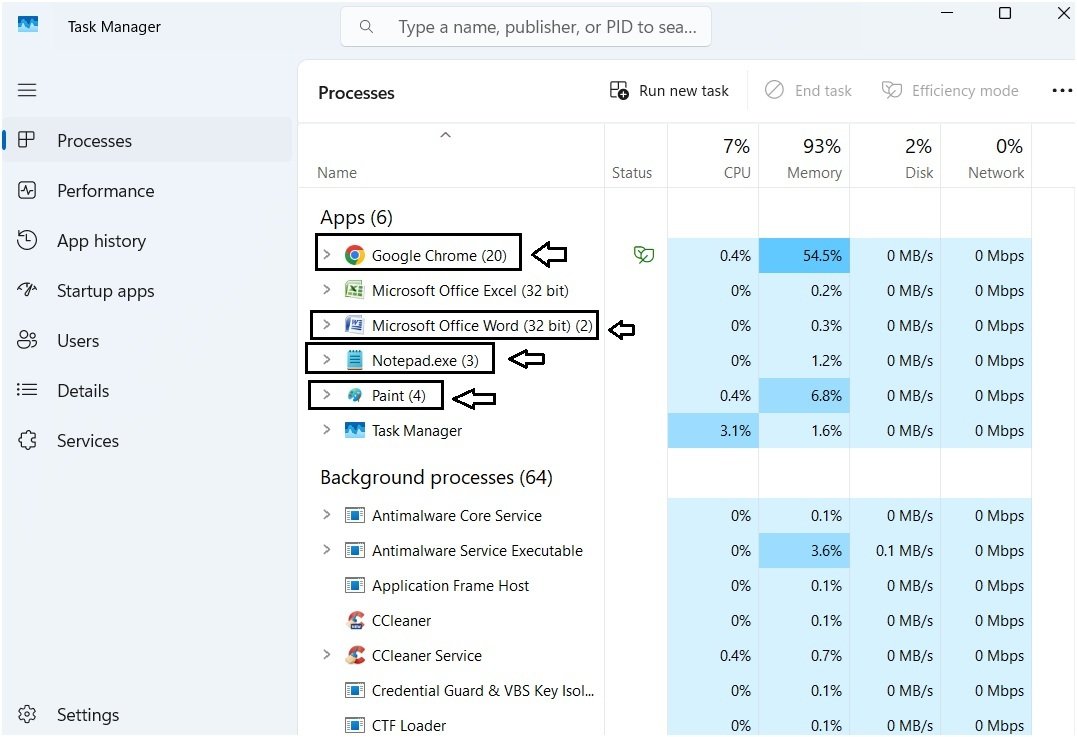
In the screenshot, I have several Notepad files, multiple Word files, and multiple Chrome tabs open. Instead of showing every visible window as a separate entry, Task Manager has grouped related activity under application entries.
At first glance, it may appear that Task Manager simply groups applications according to their type. However, if you perform some testing, you’ll discover that this behaviour is not always consistent.
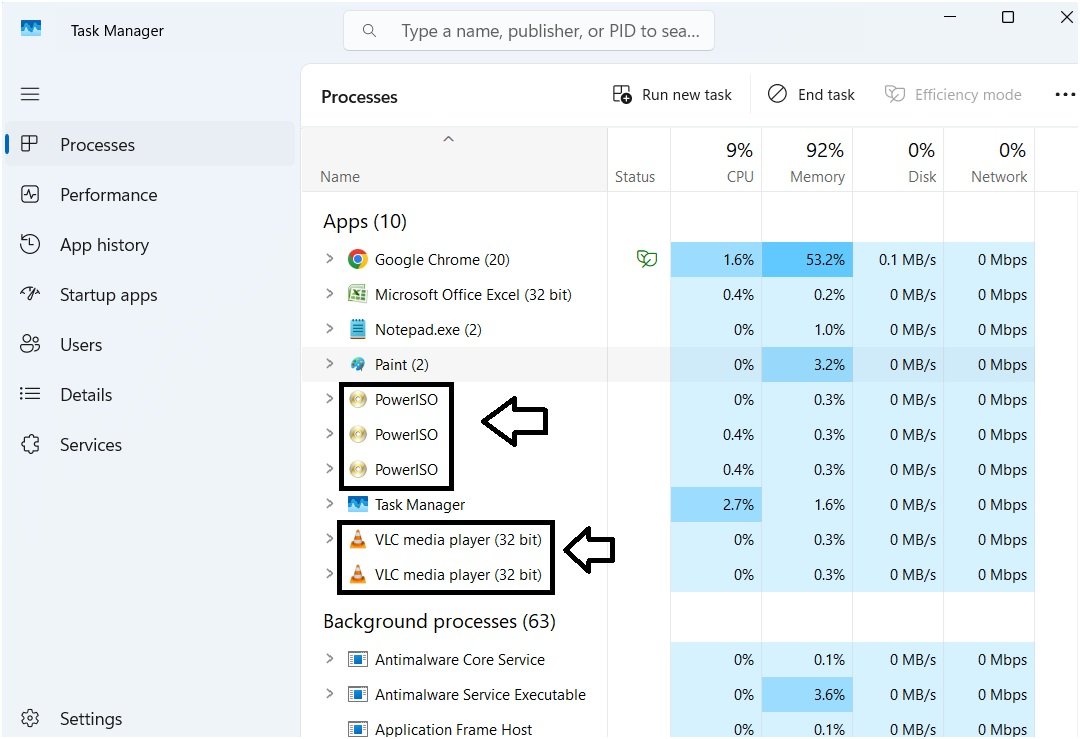
In this screenshot, several windows of the same applications are open, yet Task Manager displays them as separate entries rather than a grouped category. So how does Windows decide whether applications should be grouped?
Behind the scenes, Windows uses an identifier called the Application User Model ID (AppUserModelID or AUMID). Applications that share the same AppUserModelID can be grouped together, while applications that do not share a matching identifier may appear as separate entries.
Microsoft documents AUMID as a way for Windows to identify an application and associate its processes, files, and windows with that application.
You do not need to know or manage the actual AUMID value as an everyday Windows user, but understanding the idea behind it helps explain why some applications appear grouped while others do not. The important takeaway is this:
Task Manager often groups related processes together for convenience, but grouping is not guaranteed. Whether applications appear grouped or separately depends on how the application identifies itself to Windows.
What Does the Number in Parentheses Mean?
Here’s another common misconception. If you see an entry like “Microsoft Excel (3),” it’s natural to assume that means three Excel files are open.
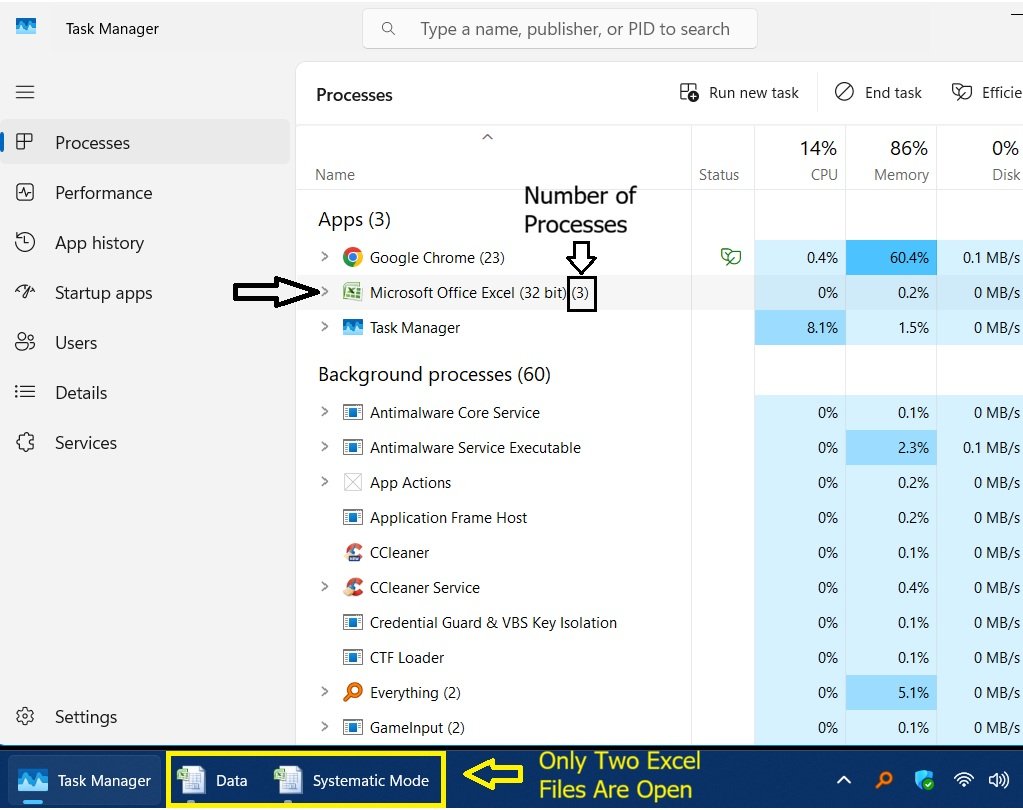
The number in parentheses represents the number of processes that Task Manager has grouped under that application entry. In the screenshot, only two Excel files are open here, yet Task Manager shows three processes. Expanding the group clears this up:
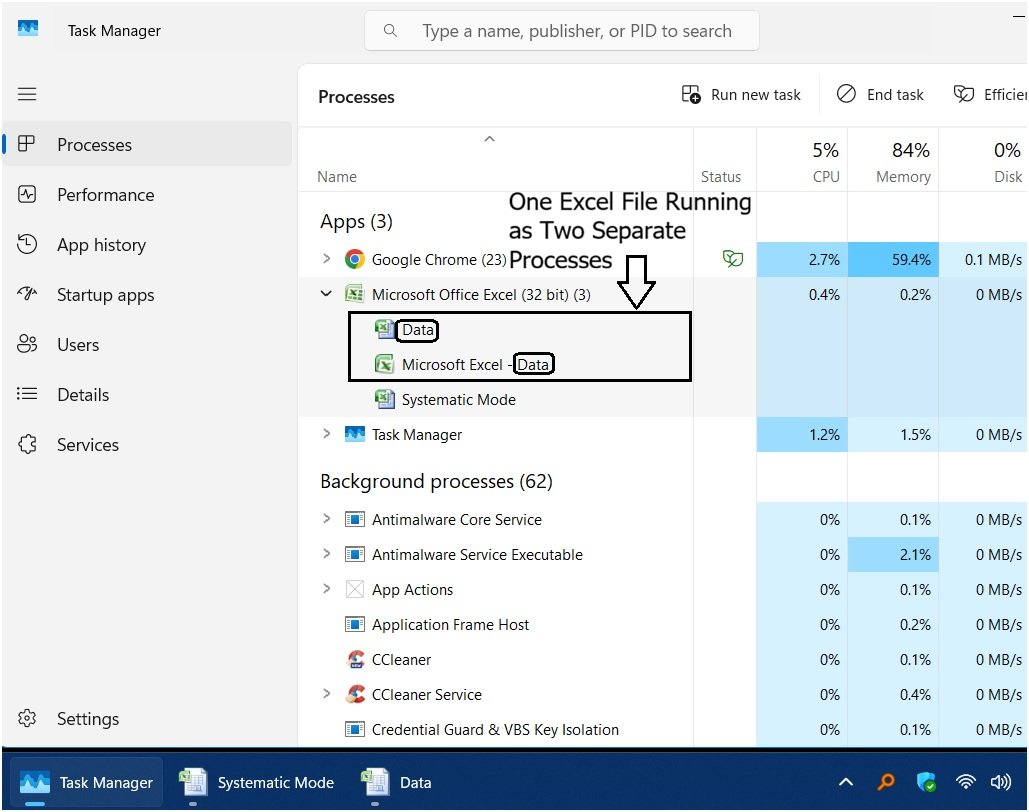
One of the two Excel files is actually running as two separate processes behind the scenes — which is what brings the total to three. This disproves another common assumption: that a single open file always runs on a single process. It doesn’t have to. Opening one file can involve two or more processes working together behind that one window.
The same idea applies to Chrome’s process count. If you see Chrome showing “(23),” that doesn’t mean 23 tabs are open — a single open tab can itself be responsible for five or six background processes, since a modern browser relies on several separate processes running together just to function smoothly.
Let’s move on to some practical, hands-on use of the Processes tab.
2.3 Ending an Unresponsive Task
This is where Task Manager becomes genuinely useful in the moment — when a program freezes and won’t close through normal means.
Open Task Manager — since Processes is selected by default and Apps sit at the top of the list, a stuck program is usually easy to spot right away. Let’s use Notepad as a simple example.
Select it, then end it one of two ways: click End Task at the top of the window, or right-click the process and choose End Task from the menu.
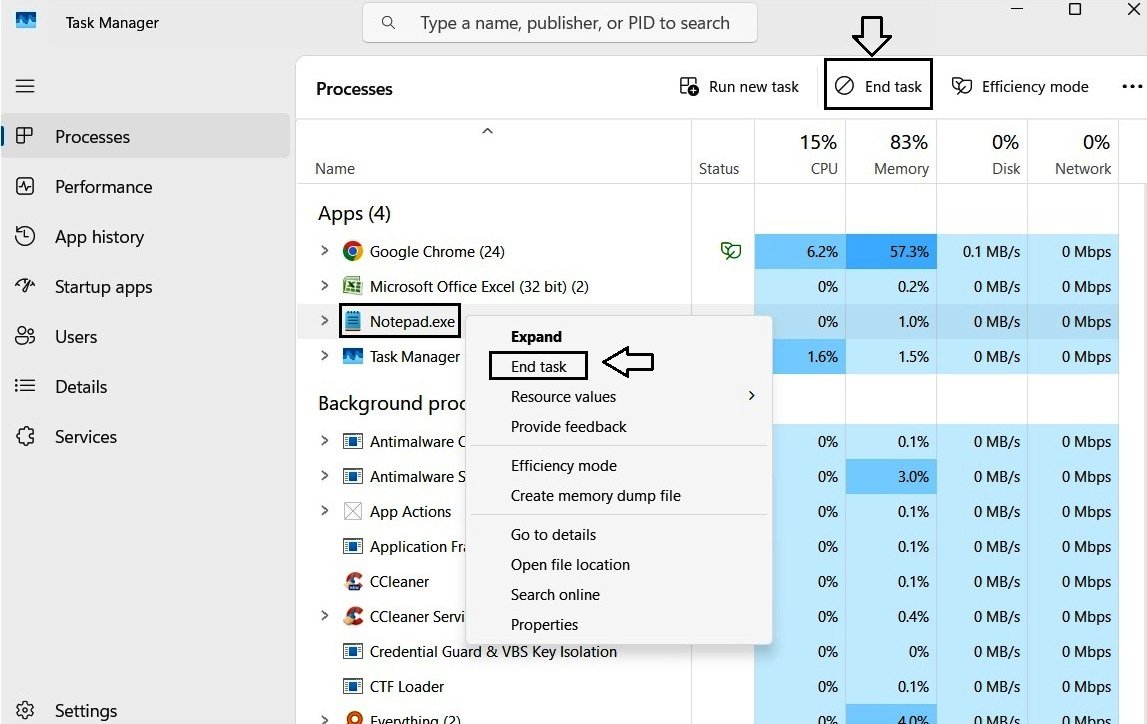
Either method works the same way. Keep in mind, though — forcibly ending a task this way means any unsaved changes in that program are lost. Most programs will reopen showing only what was last saved, and this applies the same way across different applications.
If you have multiple windows of the same app open — say, several Notepad files — and only one has become unresponsive, right-clicking the grouped entry and choosing End Task will close all of them, not just the one you want. To end a specific one, expand the group first.
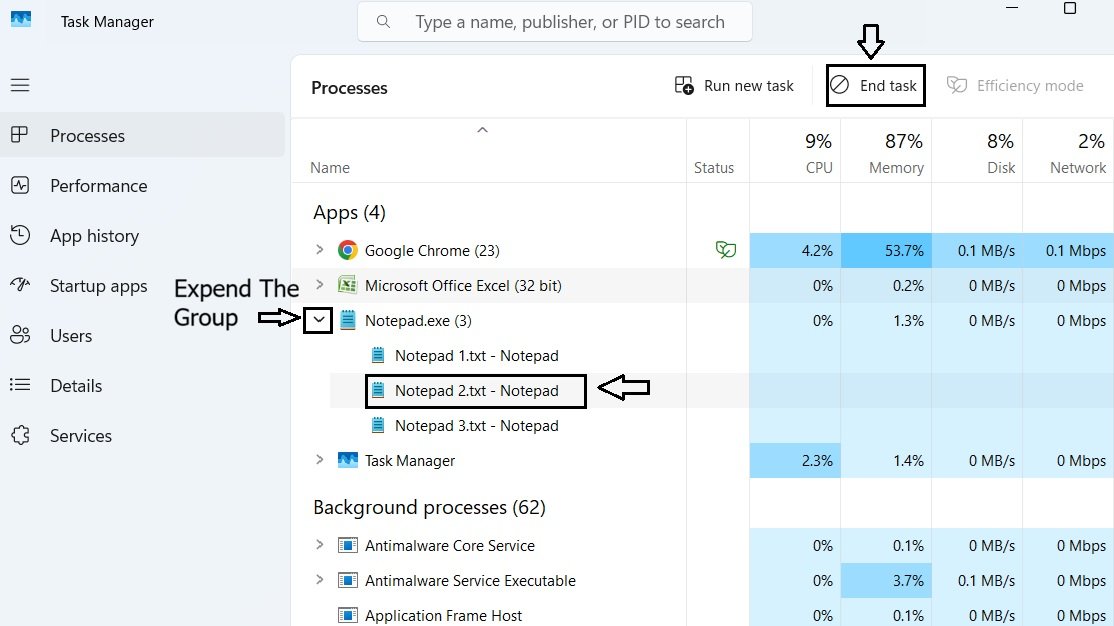
This gives you a useful rule to remember: right-click the group itself if you want to close everything under it, or expand the group first if you only want to end one specific item inside it.
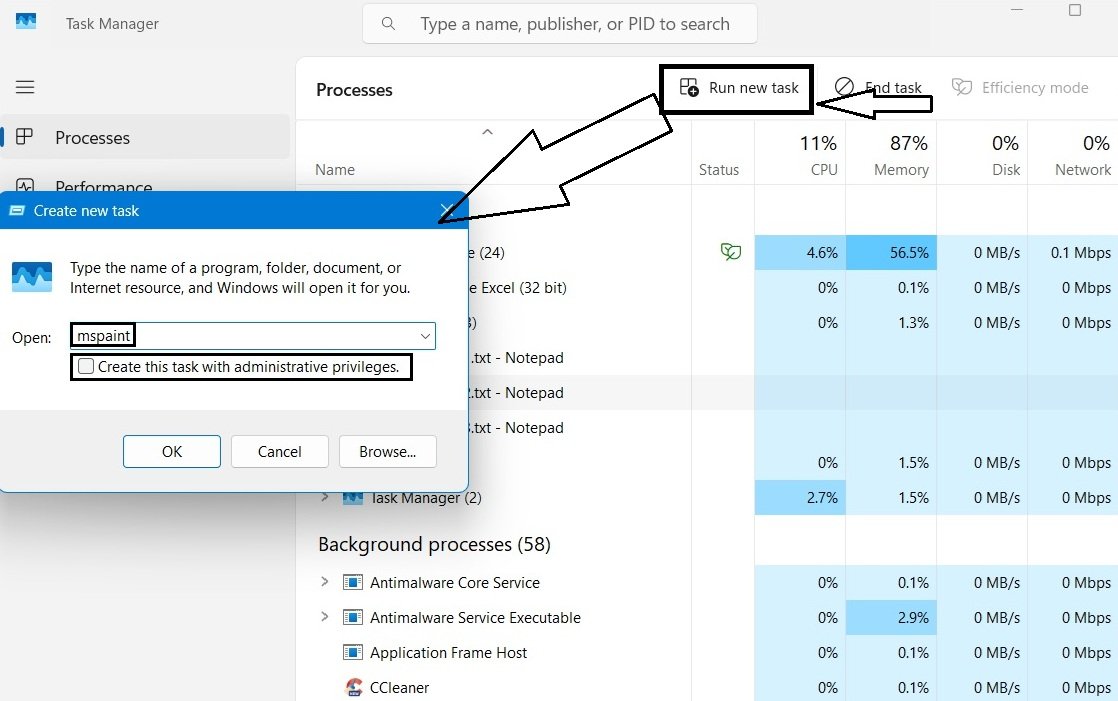
Run New Task
Next to End Task, you’ll also find Run New Task. This opens a small window — similar to the Run dialog — where you can type the name of a program, folder, or document to launch it directly.
Restart Task
For certain Windows processes — End Task is replaced with a Restart option instead.
A common example is Windows Explorer. For example, open File Explorer and locate Windows Explorer within the Processes page. When selected, you may notice that Restart task becomes available.
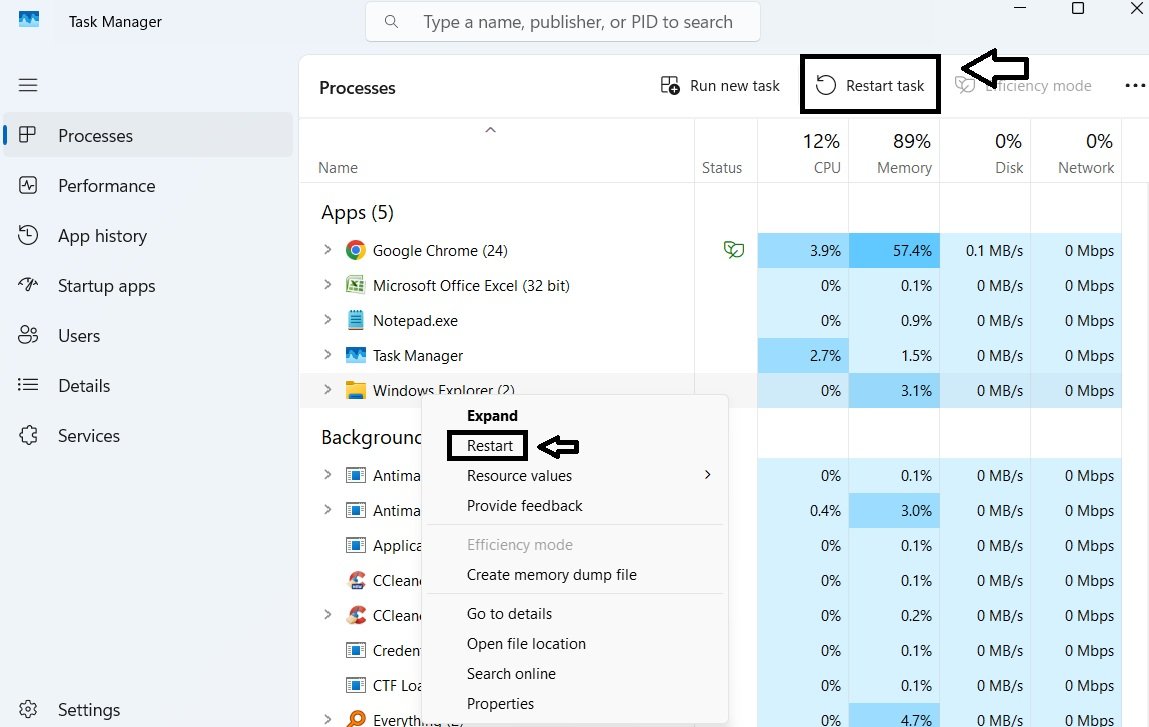
When you choose Restart, the taskbar and desktop may briefly disappear before immediately reloading. Any File Explorer windows that were open may also close.
Windows Explorer is treated differently from most applications because it manages important parts of the Windows interface. For convenience, Task Manager provides a Restart option that quickly reloads Windows Explorer without requiring you to sign out or restart the entire computer.
2.4 The Resource Columns
Alongside each process, Task Manager shows four resource columns: CPU, Memory, Disk, and Network.
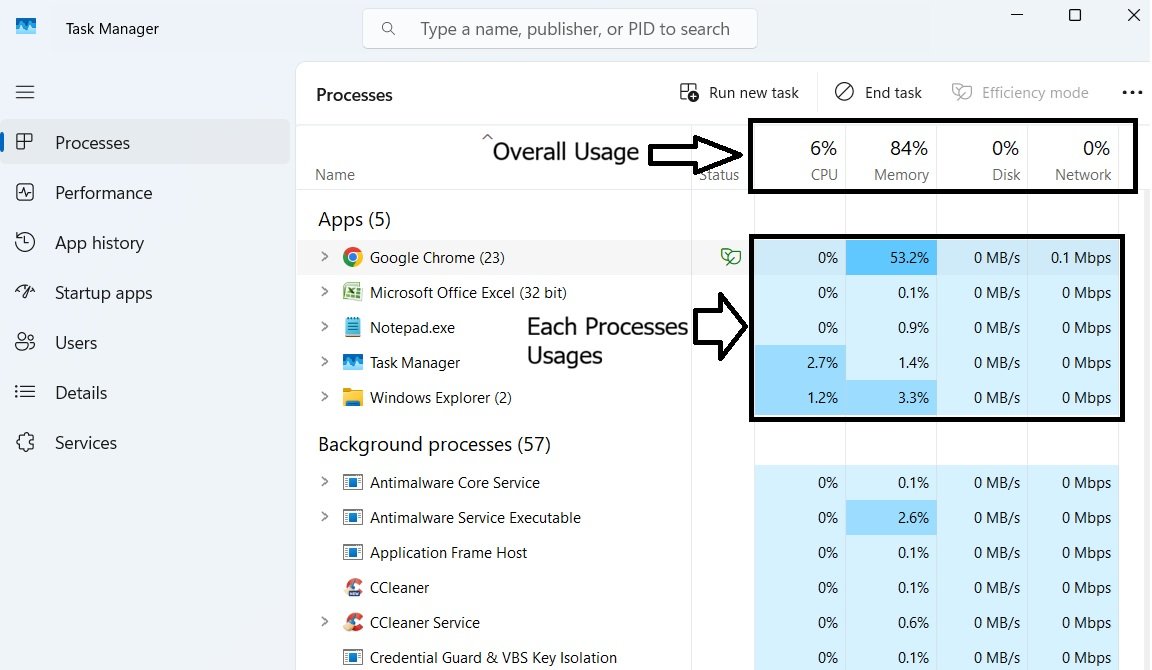
On top, Task Manager shows the current overall usage for the PC. Underneath, each process has its own value.
Each column shows what percentage of that particular resource a process is currently using. Most processes will sit at or near 0% most of the time — but every process you see here depends on these same four resources to function, which is exactly what makes this view so useful for investigation. If you ever suspect a program is using more than its fair share, this is where you’d look to confirm it.
Efficiency Mode
Near End Task, you’ll also find Efficiency Mode — available for most regular apps, though not for core Windows processes like Explorer or Task Manager itself.
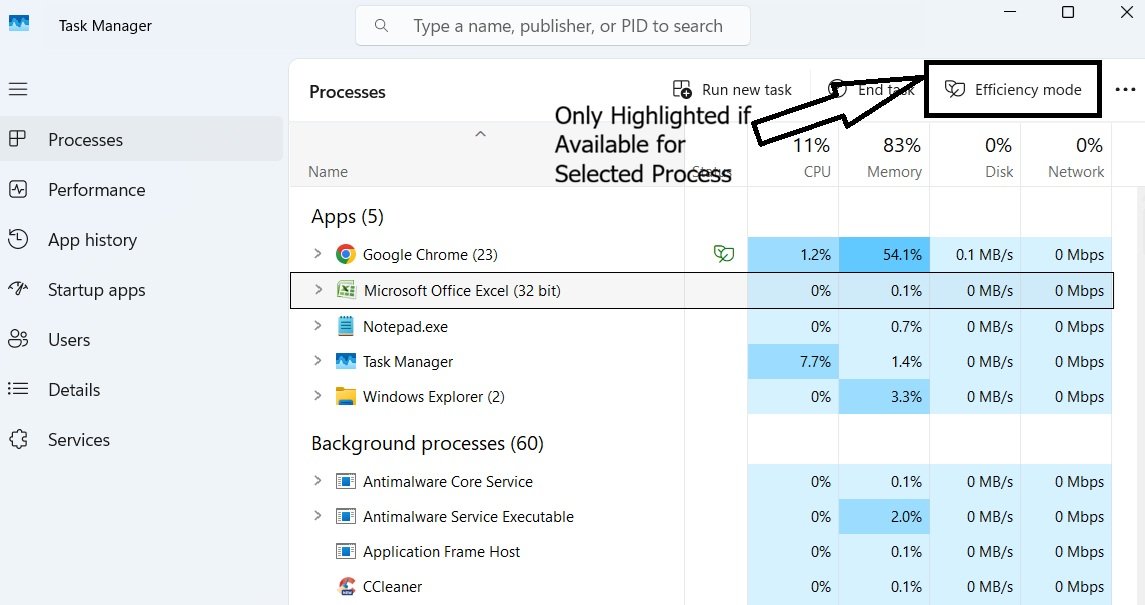
When you select Efficiency mode, Windows displays a warning before enabling it.
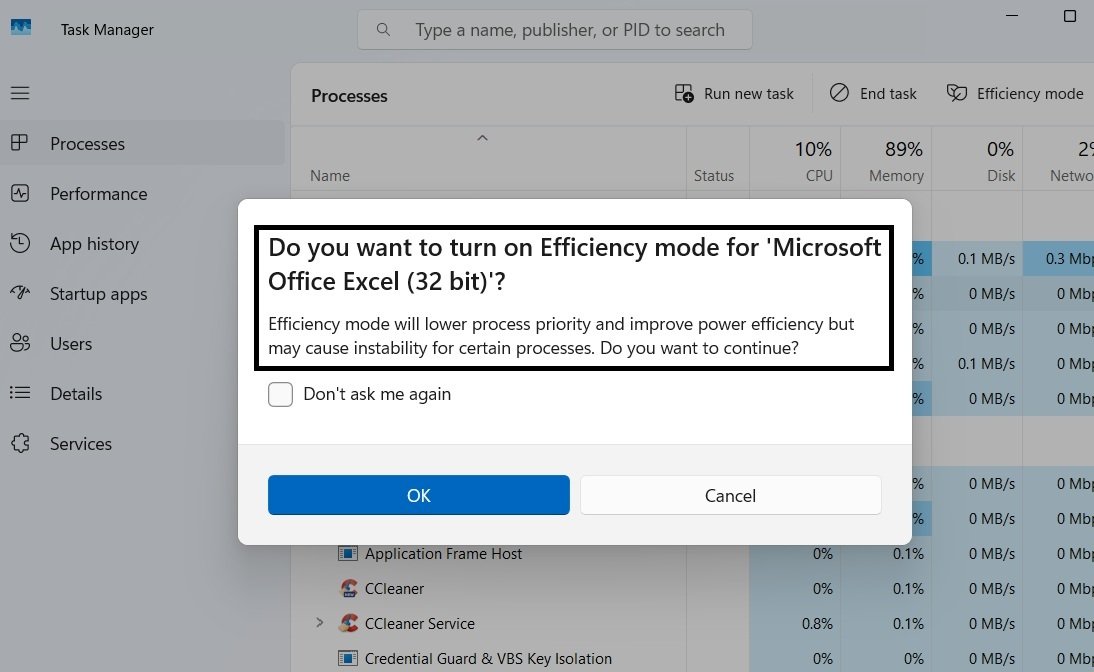
In simple terms, Efficiency Mode tells Windows to use fewer CPU and other system resources for a particular process. This can help reduce power usage and leave more resources available for other processes.
However, reducing resources can also affect the performance of an app that needs more CPU power. It’s best to use Efficiency Mode only when you know the process doesn’t need full performance. Otherwise, you can leave it at its default setting, which is off.
Some apps — Chrome being a common example — can enable this automatically on their own background processes to save memory. When that happens, you’ll notice a small leaf icon next to the process in the Status column.
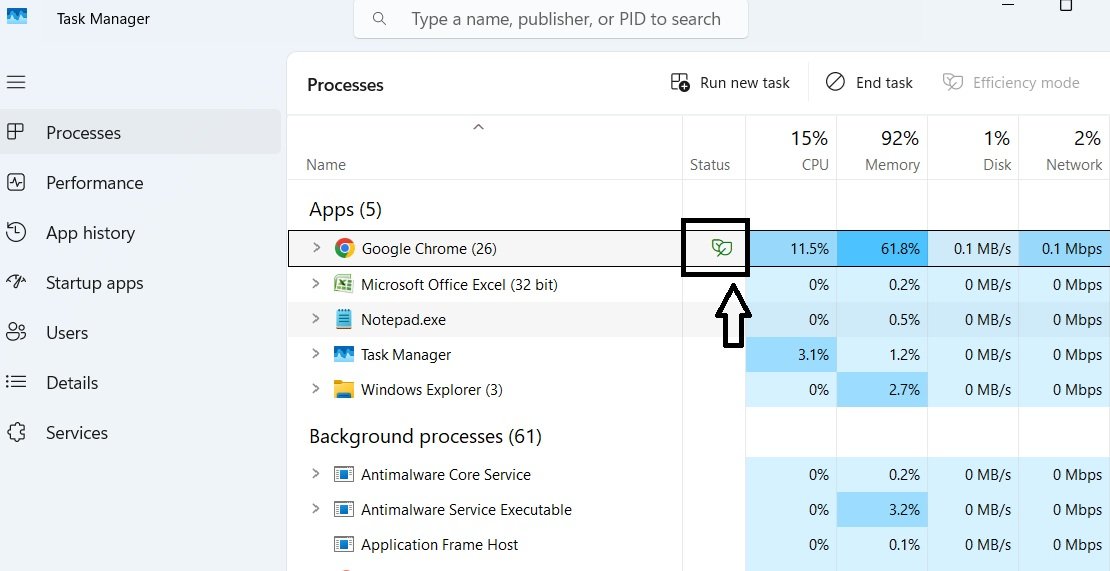
Hovering over that icon shows a short tooltip confirming it’s active for that process.
2.5 Ending a Background Process
Apps processes, as covered earlier, are the ones started directly by the user. Below them sit Background Processes — these aren’t started by the user directly, and most of them launch automatically the moment your PC starts up. That’s why you’ll typically find a large number of them running at any given time.
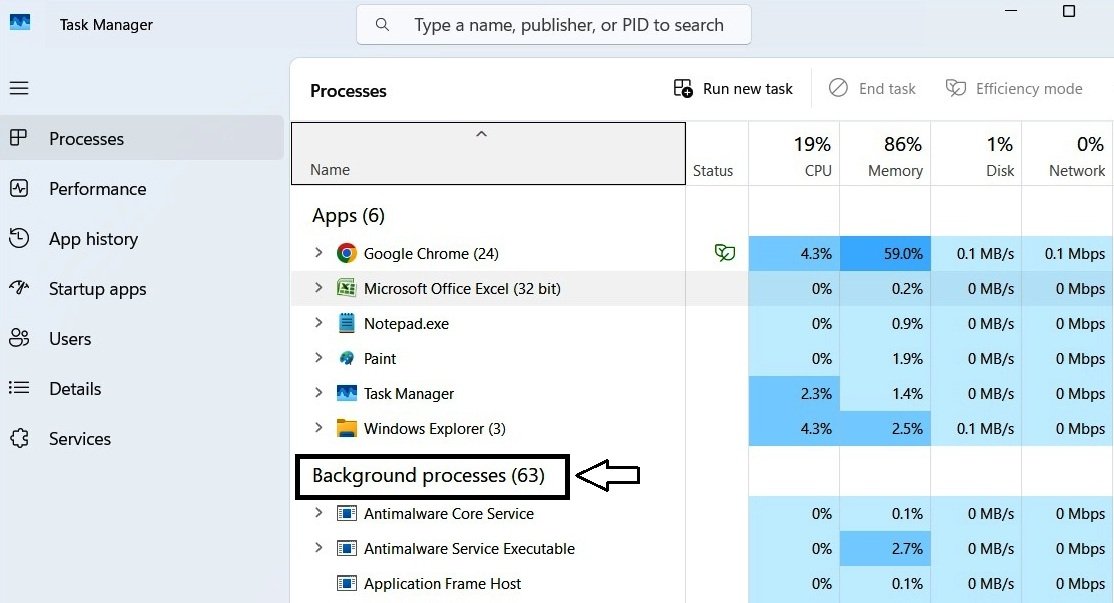
In this example, there are 63 background processes currently running — though this number changes constantly as processes start and stop on their own. For most everyday use, you won’t need to touch anything here, since the majority are run by Windows itself and are necessary for your PC to function. That said, third-party software you install often adds its own background processes too, and if you’re ever troubleshooting a slowdown or just curious what’s using your resources, this is the place to check.
For example, I have a third-party tool called “Everything” installed on this PC, which runs its own background process — there’s nothing wrong with it; it’s just being used here as an example. To check how much it’s using, go to Background Processes and look for it by name.
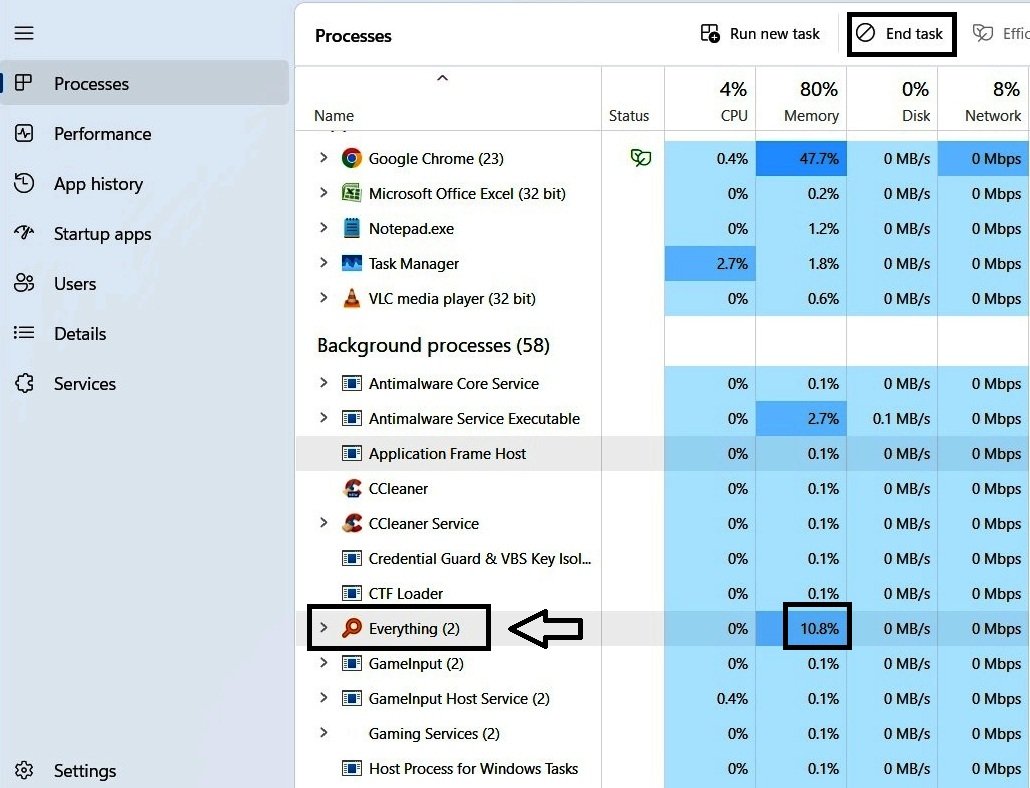
It’s using about 10.8% memory — on an 8 GB system, 10.8% is roughly 0.86 GB, or around 880 MB. This is how you can identify which background process is using your resources. If you decide to end one, right-click it and select End Task — but be cautious. Only end a background process if you’re confident about what it is and what it does; if you’re unsure, it’s safer to leave it alone.
Can an Apps Process Turn Into a Background Process?
Here’s an interesting behavior worth knowing. Normally, an application you’ve opened — something visible on the taskbar — shows up under Apps. But what happens if you minimize that same application to the notification area instead? Let’s find out.
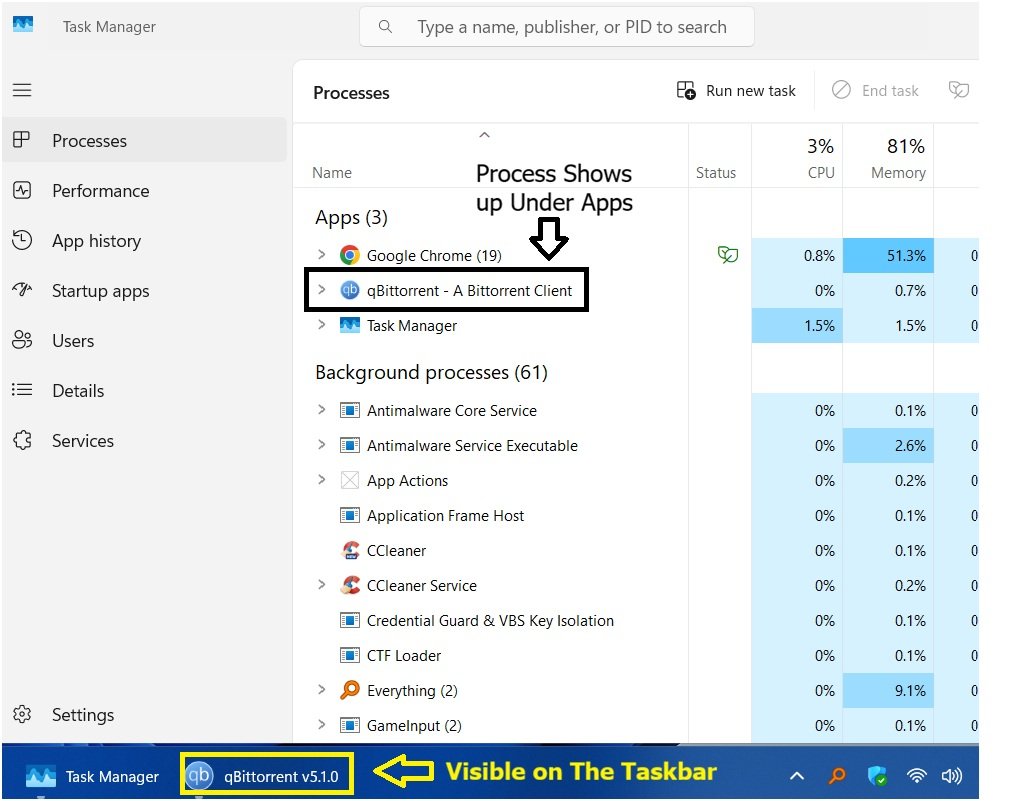
Here, qBittorrent is open on the taskbar, and its process appears under Apps, exactly as expected. Now, minimizing it to the notification area:
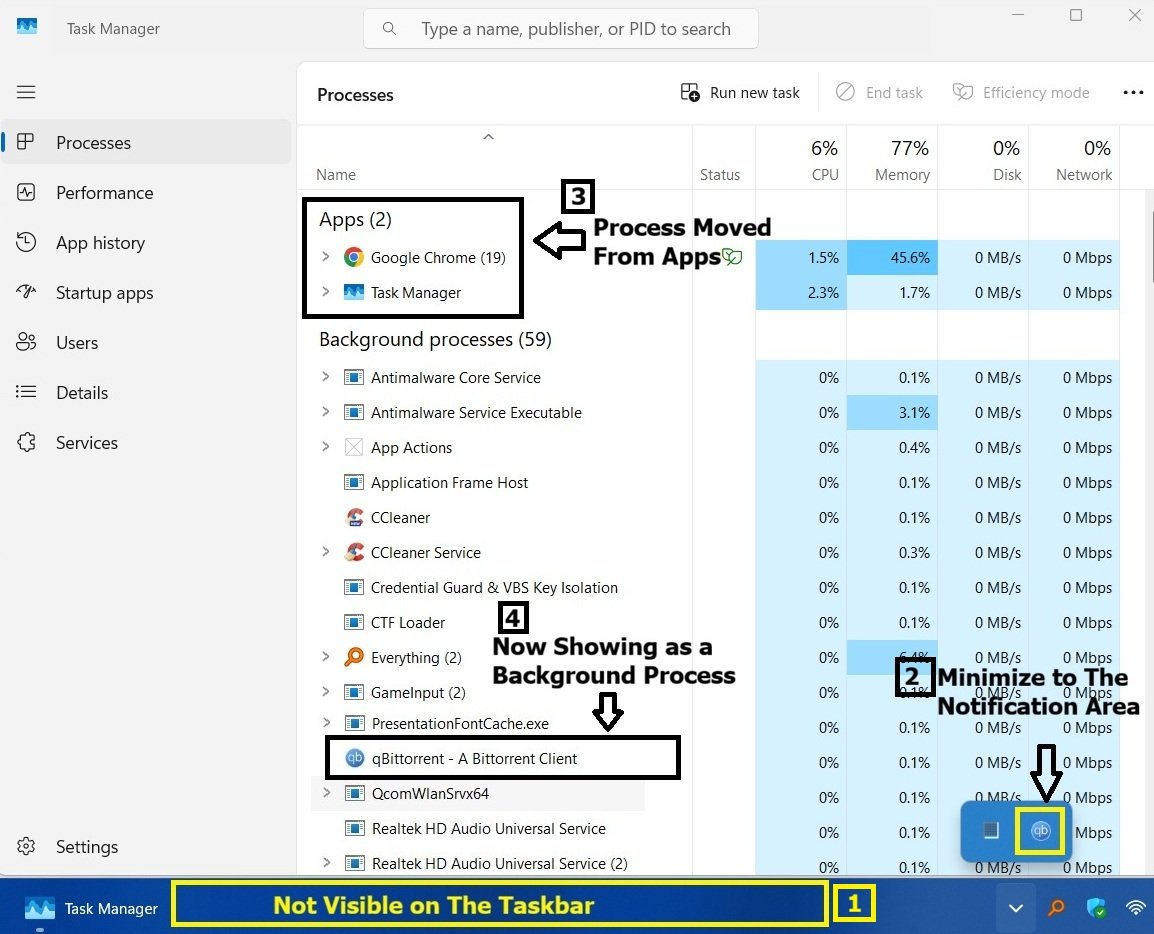
As soon as the qBittorrent is minimized to the notification area, its process moves from Apps into Background Processes. This makes sense once you think about what separates the two categories in the first place — Apps are specifically processes with a visible window, and the moment that window disappears from the taskbar, Windows no longer has a reason to list it there.
I’ve only confirmed this with one application here, so I’d encourage you to try it yourself with a few others — but the reasoning behind it (visible window vs. no visible window) suggests this isn’t a one-off quirk tied to qBittorrent specifically.
The third category, Windows Processes, mostly relates to Windows’ own internal settings and requirements rather than anything an everyday user needs to interact with — so we won’t go into detail on it here.
With that, Part 2 — Processes is complete. Let’s move on to the next section: Performance.
Part 3: Understanding Performance in Task Manager
This section moves away from individual processes and looks at your PC as a whole — how hard your CPU, memory, storage, network, and graphics hardware are working right now, shown through live, real-time graphs.
3.1 A Quick Look at the Performance Page
When you switch to the Performance tab, Task Manager replaces the process list with a hardware navigation sidebar on the left and a detailed metric graph on the right.
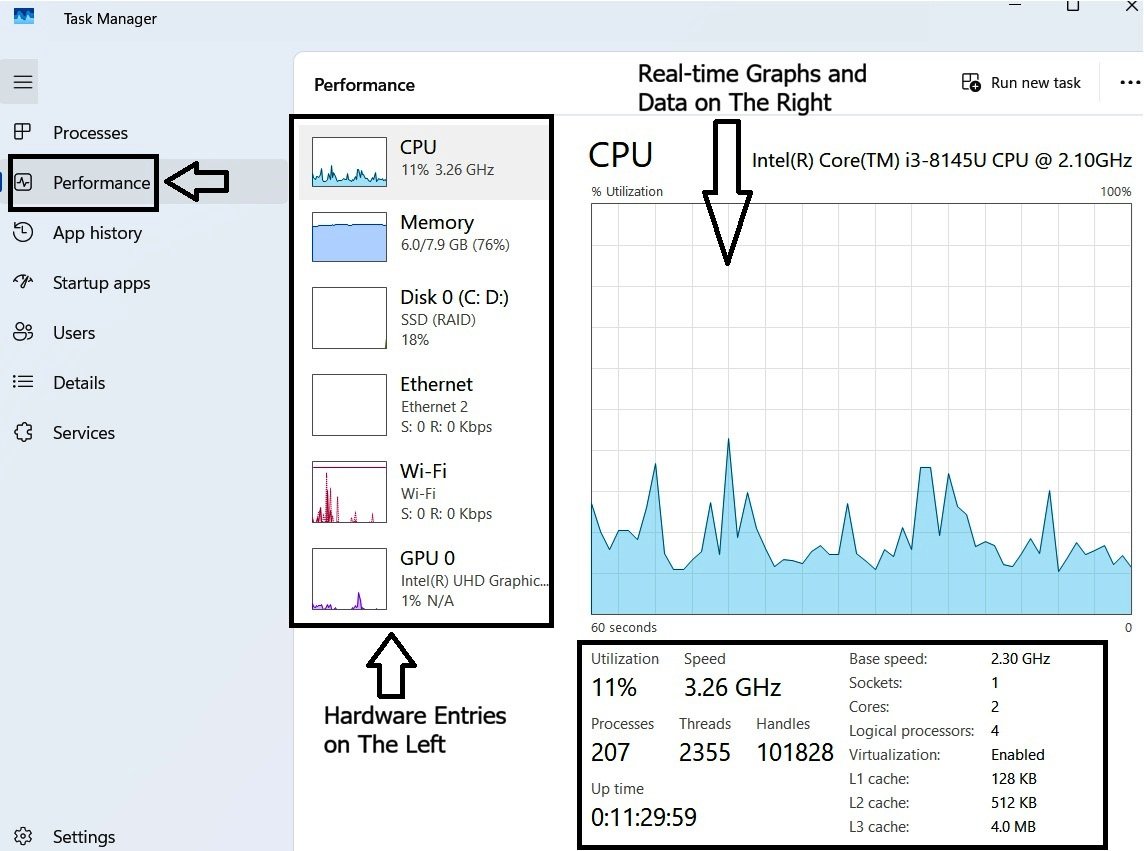
On this PC, the Performance tab lists six items: CPU, Memory, Disk 0 (C: D:), Ethernet (shown blank since it isn’t connected), Wi-Fi (connected), and GPU 0. Where the Processes tab tells you who is doing the work, the Performance tab tells you how hard your hardware itself is working — real-time graphs and figures for your system’s overall resource usage, rather than a breakdown by individual program.
Worth keeping in mind: this list isn’t fixed, and it won’t necessarily look the same on another PC. If a system has more than one drive or an additional graphics card, those will show up as their own separate entries — Disk 1, GPU 1, and so on. Network entries can also differ depending on how that PC connects to the internet.
To see this in practice, here’s what happens when a second drive is connected to this same PC:
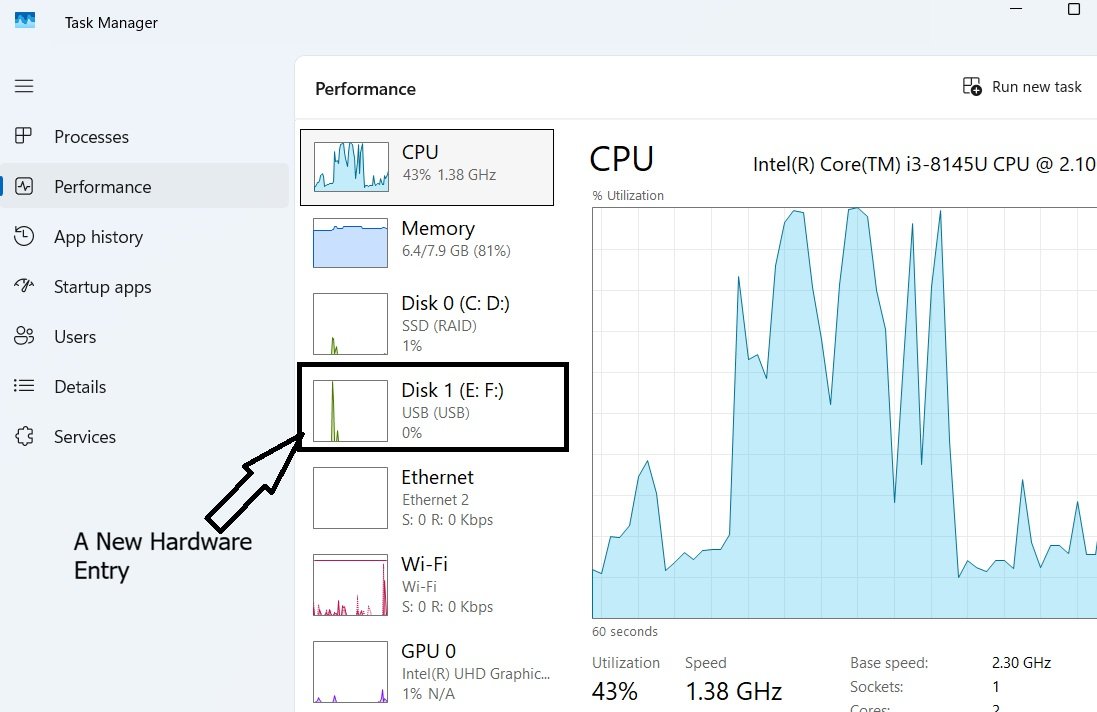
A new entry, Disk 1 (E: F:), appears right under Disk 0 — confirming that what you see here reflects your specific hardware, not a fixed list every PC shares.
3.2 Understanding the Main Tabs
With the overview out of the way, let’s go through each of these one by one.
CPU
By default, the CPU tab is usually selected when you first open the Performance page.
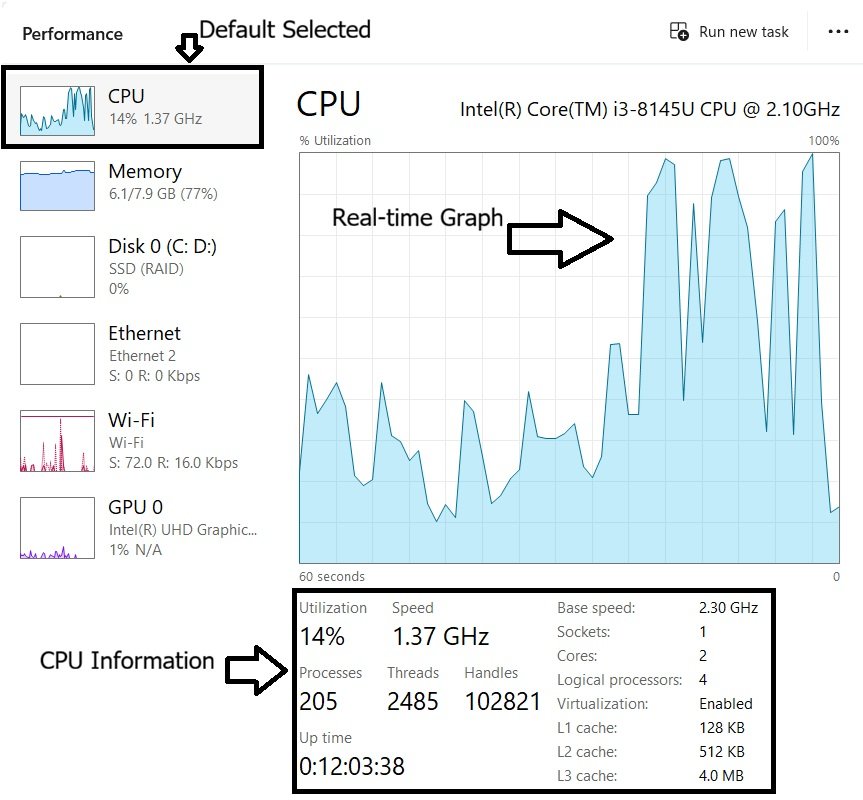
At the top, you’ll see your CPU’s name, with the live usage graph taking up the center of the page. Below that sits a row of figures: Utilization (the percentage currently in use), Speed, Processes, Threads, Handles, Up time, Base speed, Sockets, Cores, and Logical processors — along with whether Virtualization is enabled.
In simple terms, cores and logical processors represent how many tasks your CPU can genuinely handle at once — more of either generally means better multitasking ability. The utilization percentage simply reflects how much of that total capacity is in use at any given moment, and it’s normal for this number to constantly rise and fall as different programs make demands on it — a brief spike to 90–100% isn’t automatically something to worry about.
Memory
The Memory tab focuses on your computer’s physical memory, commonly known as RAM (Random Access Memory).
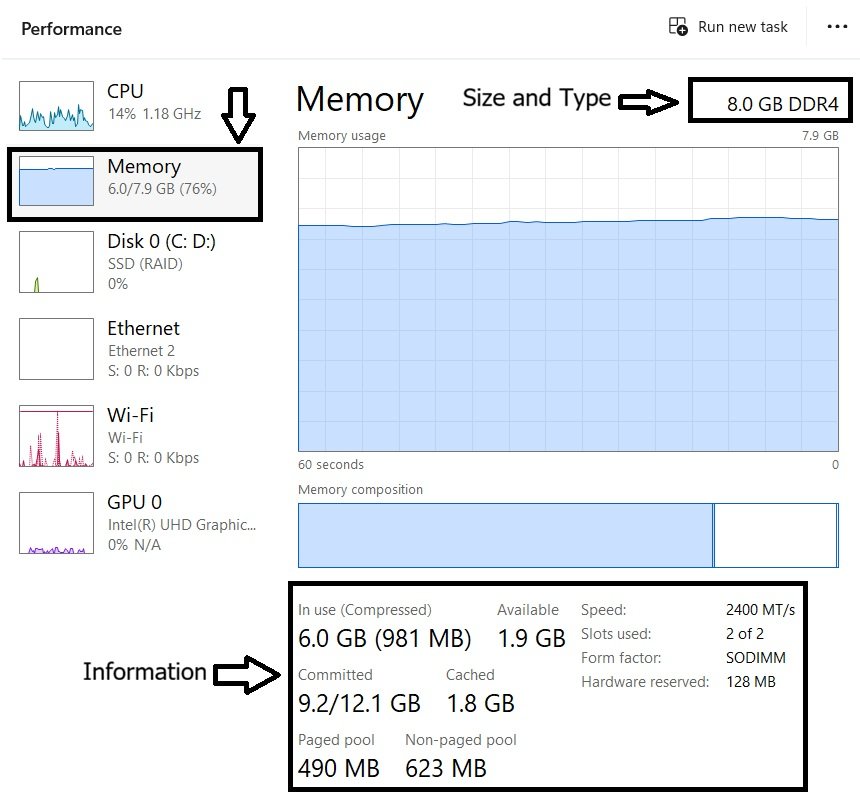
At the top, you’ll see how much of your total memory is currently in use, alongside the overall percentage. On the right, you’ll find your RAM’s capacity and type — for example, 8 GB DDR4. Below that sits a row of figures worth understanding:
- In use (Compressed) — the main figure is how much physical RAM is currently in use; the number in parentheses shows how much of that is being held in a compressed state.
- Available — memory that can be handed to a new process immediately if needed.
- Committed — this is your system’s total reserved memory, combining RAM and the page file, shown as current usage against the maximum available.
This number can look confusing at first, since the total often exceeds your actual RAM size. That’s because the limit shown isn’t just your physical RAM — it’s RAM, plus your page file (a portion of your storage drive Windows uses as overflow memory) combined. So on an 8 GB system, seeing a commit limit of 12 GB simply means Windows has a roughly 4 GB page file adding to that total — it’s normal, not an error. - Cached — data Windows is keeping in memory even though it’s not actively needed right now, so it doesn’t have to be reloaded from your disk if you need it again soon.
- Paged pool — a reserved area of memory used by Windows and device drivers, which can be moved to disk if needed.
- Non-paged pool — similar, but this memory must always stay in physical RAM and can’t be moved to disk.
A common misconception worth clearing up:
Many people assume high memory usage, or high “Cached” numbers specifically, means something is wrong — the thinking being “free RAM is good RAM.” In reality, it’s the opposite. Windows deliberately uses available memory to cache data for faster access, since unused RAM isn’t doing you any favors sitting empty. High cached memory is normal, expected, and generally a sign Windows is managing memory efficiently — not a problem to fix.
It’s also worth remembering that RAM (memory) and your storage drive (disk) are two different things — RAM is temporary working space your PC uses while it’s running, not where your files are permanently stored.
Disk 0 (C: D:)
The Disk tab displays information about storage activity.
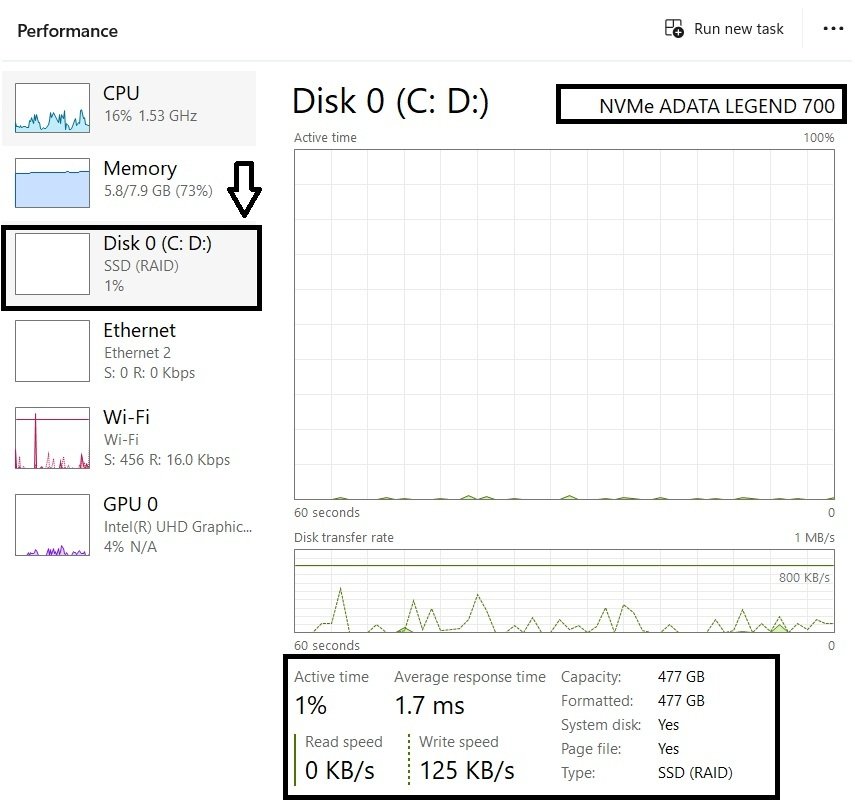
This tab shows your drive’s name and type on the right — alongside figures for Active time (the percentage of time the drive is busy), Average response time, Read speed, and Write speed, along with its Capacity, file system format, and whether it’s your system disk or holds your page file.
Active time is the figure worth paying attention to here — if it’s sitting consistently high, your PC may feel sluggish, since the drive is spending most of its time busy rather than idle.
Wi-Fi / Ethernet
Which network tab is active depends on how your PC connects to the internet — here, since this PC connects over Wi-Fi, the Ethernet tab stays blank. The Wi-Fi tab displays information about your wireless network connection.
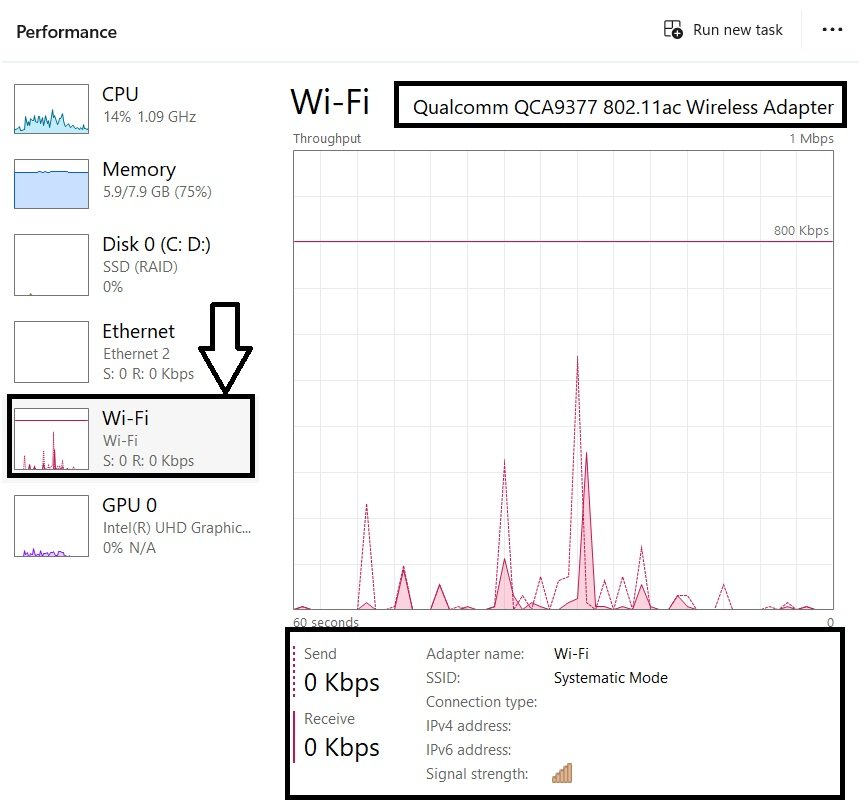
This tab shows your current Send and Receive speeds, along with your wireless adapter’s name, SSID, connection type, IPv4/IPv6 address, and signal strength.
GPU 0
The GPU tab provides information about the system’s graphics processor. GPU stands for Graphics Processing Unit.
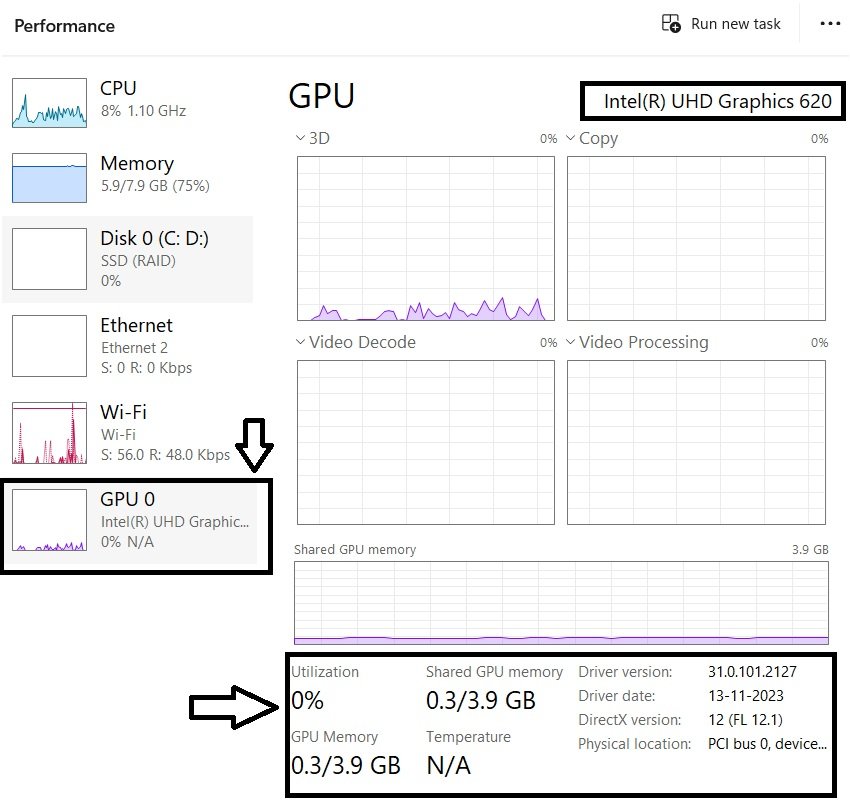
If a PC has more than one graphics processor, additional ones appear as GPU 1, GPU 2, and so on — this one is labeled GPU 0 since it’s the only one installed. The tab shows the GPU’s name, its usage percentage, and a row of details: Utilization, GPU memory, Shared GPU memory, Temperature, Driver version, Driver date, DirectX version, and Physical location.
In all of these tabs, you’ve seen a live graph sitting in the middle of the page — now let’s learn how to actually read it.
3.3 How to Read the Graph
Reading these graphs well comes down to a few simple ideas — nothing technical, just knowing what’s normal and what’s worth a second look.
Spikes vs. Sustained Usage
A sudden spike to 100% — say, right when you open a program — is completely normal and nothing to worry about. What actually matters is sustained high usage: if your CPU or disk is stuck near 100% while your PC is sitting idle with nothing obviously running, that’s a sign something may be using more than its fair share.
You may also notice small, random bumps in activity even when you’re not doing anything — this is normal too, since Windows regularly performs minor background maintenance on its own.
The key principle to take away: a resource consistently sitting near 100% tells you it’s the current bottleneck — but that doesn’t automatically mean something is wrong. It means it’s worth investigating further, not that there’s necessarily a problem.
Changing the Graph Layout
Some tabs let you switch how their graph is displayed. On CPU, the default view shows Overall utilization — right-click anywhere on the graph and choose Change graph to → Logical processors to break it down into individual processor cores instead.
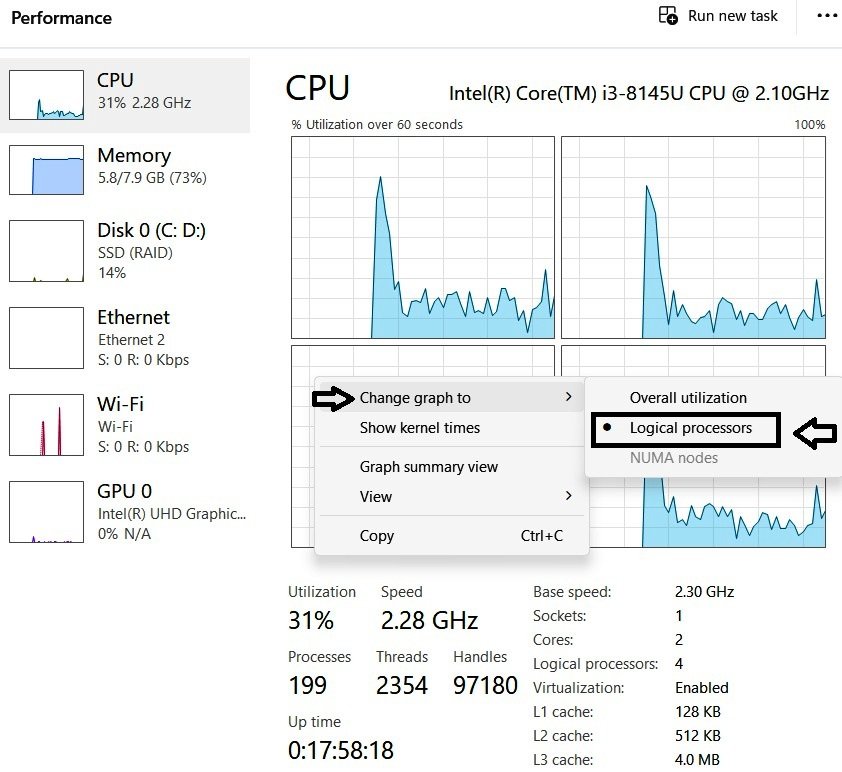
‘Overall utilization’ shows your CPU’s total usage as one combined figure, while ‘Logical processors‘ breaks that same usage down core by core — useful if you want to see whether a task is being spread across your CPU evenly or relying heavily on just one or two cores.
The GPU tab works similarly. By default, it’s set to Single engine — right-click and you can switch to Multiple engines instead.
Graph Summary View
You can also collapse the Performance tab into a compact, graph-only view at any time. Double-click anywhere inside the main graph, or right-click it and choose Graph summary view.
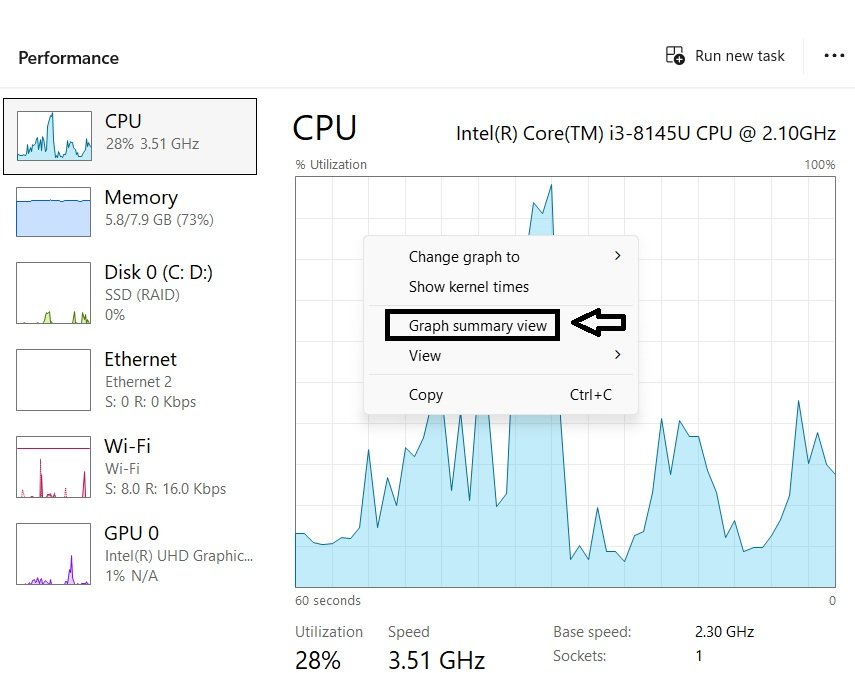
Selecting it collapses the entire window into just that one graph, hiding the sidebar list entirely — handy if you want to keep an eye on a single resource without the rest of the window taking up space. Right-click (or double-click) again to return to the normal view.
Hide Graph (Sidebar Thumbnails)
This same Graph summary view option is also available by right-clicking directly on the sidebar list itself — but doing so reveals a second, separate option alongside it: Hide graph (or Show graph, depending on its current state).
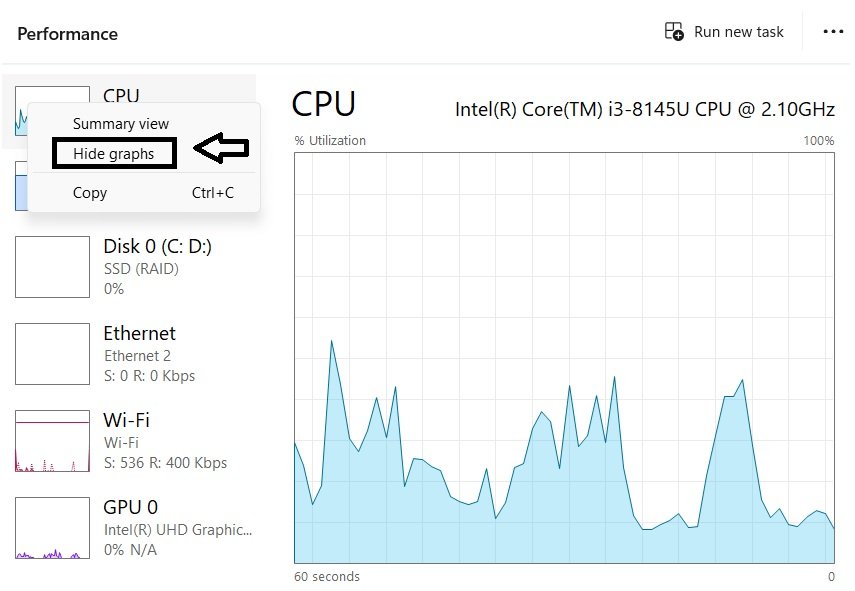
This one is different from Graph Summary View — it doesn’t touch the main graph at all. Instead, it controls the small thumbnail graphs shown beside each resource’s name in the sidebar list itself.
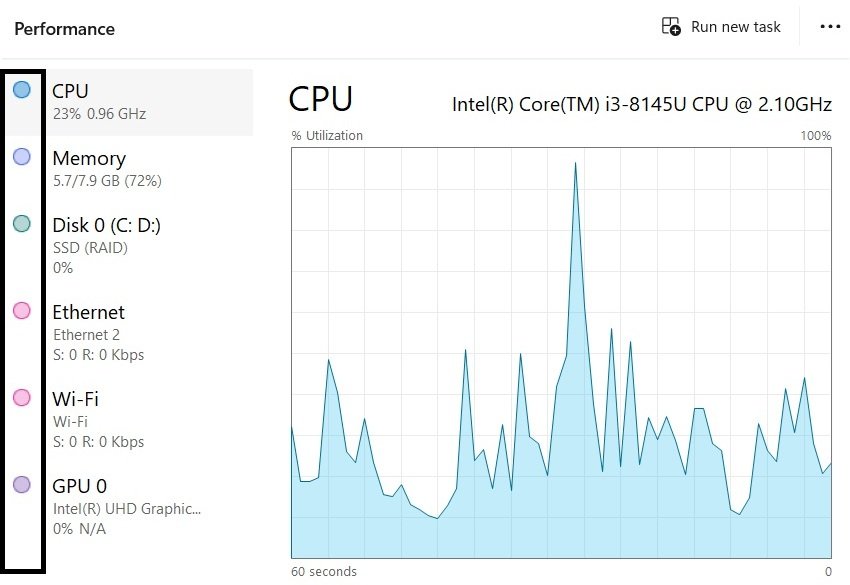
Remember, turning this off removes the thumbnail graphs for the entire sidebar list, not just the entry you right-clicked — it’s one shared setting for the whole list, not something you can apply to just one tab at a time.
Resource Monitor and Copy
Clicking the three-dot menu (…) in the top-right corner of any tab gives you two additional options: Copy and Resource Monitor.
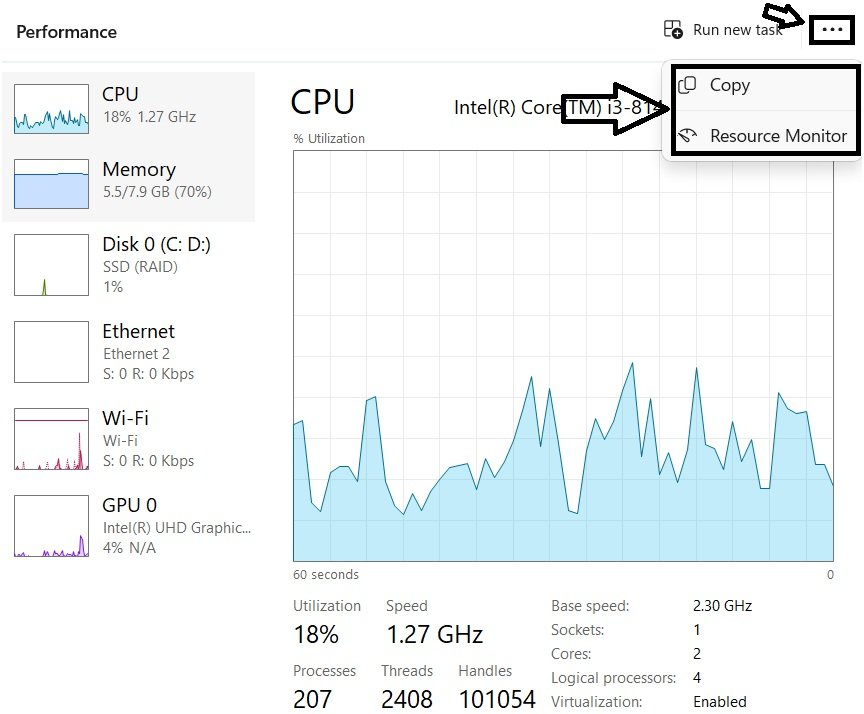
Copy lets you copy that tab’s current information so you can paste it elsewhere — useful if you’re documenting something or sharing details with someone else. Resource Monitor opens Windows’ more advanced Resource Monitor tool directly. Both options are available on every tab, not just the one you happen to be viewing.
That covers Part 3 — Performance. Next, let’s move on to Startup Apps.
Part 4: Understanding Startup Apps in Task Manager
Although the next section in Task Manager is App History, we’ll temporarily skip it and move directly to Startup Apps, as it is a feature that many everyday users actively interact with.
Startup management has been part of Windows for a very long time. This is a feature I’ve been using since the Windows XP era. Up until Windows 7, startup management was handled through the System Configuration utility (msconfig). Starting with Windows 8, Microsoft moved this functionality directly into Task Manager, making it much more accessible.
Interestingly, if you still open System Configuration in Windows 11 by typing msconfig in the Run dialog, you’ll find the Startup tab is still there—but it now simply tells you that startup settings are managed through Task Manager and provides a direct link to open it.
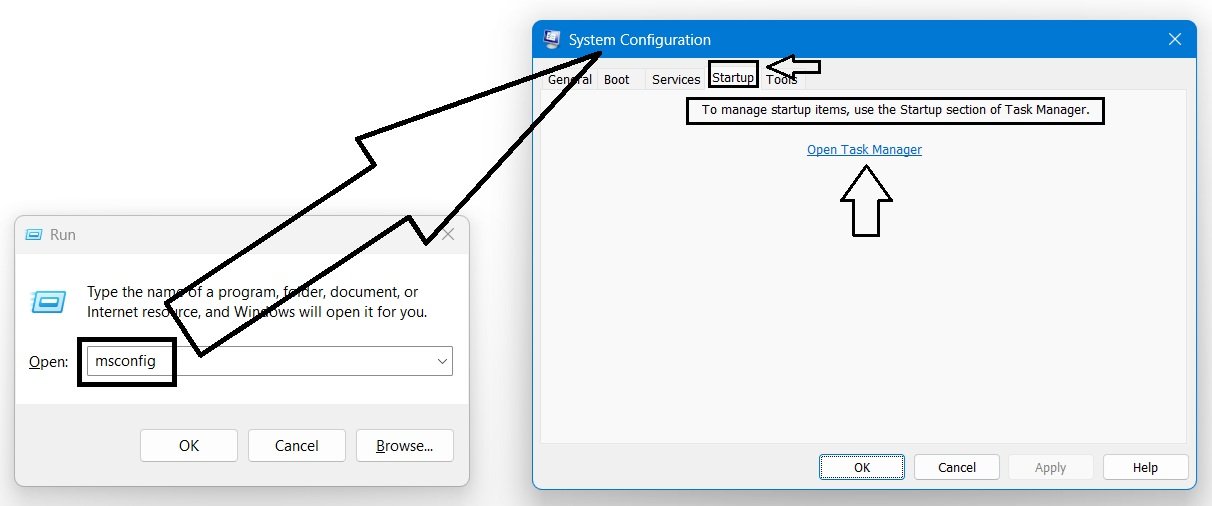
Now, let’s understand what a startup app actually is.
4.1 What Is a Startup App?
A startup app is a program configured to launch automatically the moment you sign in to Windows — rather than waiting for you to open it yourself. This exists purely for convenience: certain apps are meant to be ready and available right away, without you having to manually start them every single time you sign in.
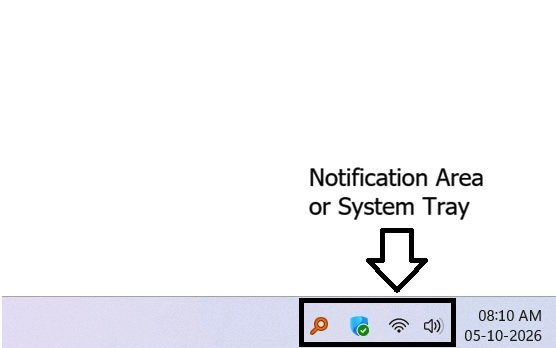
You’ll often notice startup apps in the notification area near the clock, commonly known as the system tray. However, not every startup app appears here, and not everything visible in the system tray necessarily started automatically with Windows. It is simply one of the most common places where running startup applications become visible.
Let’s answer a few common questions directly.
When does it run? A startup app launches as part of the sign-in process for your Windows user account, rather than as part of the earlier system boot process. Windows may not launch every startup app at exactly the same moment; some may start shortly after you sign in.
Why do apps choose to start automatically? Usually for convenience — so the app is already running and ready the moment you need it, instead of making you wait for it to open and load from scratch.
Does starting up mean a window immediately appears? Not necessarily. Many startup apps launch quietly in the background with no visible window at all, and only become active or show themselves when you actually need them.
Startup applications can come from various sources. Some are components installed by Windows or Microsoft software, while others are added by third-party applications you install yourself. The important thing to understand is that not every startup app is equally necessary. Some provide useful functionality that users expect immediately after signing in, while others may simply be launching for convenience.
It’s also worth understanding why software developers add startup behavior in the first place. Applications such as OneDrive, Spotify, Steam, and various messaging or cloud-sync tools often start automatically so they are immediately available when needed. For example, a cloud-sync application can begin syncing files as soon as you sign in, while a messaging application can start receiving notifications right away.
That convenience, however, comes with a trade-off. The more startup applications Windows loads during sign-in, the more work it must perform before your desktop is fully ready. Startup apps also continue to consume system resources while they remain running in the background.
Now, let’s look at the Startup Apps page itself and learn how to read the information it provides.
4.2 Reading the Startup Apps List
Let’s look at what this list actually looks like. Open Task Manager and click on Startup apps.
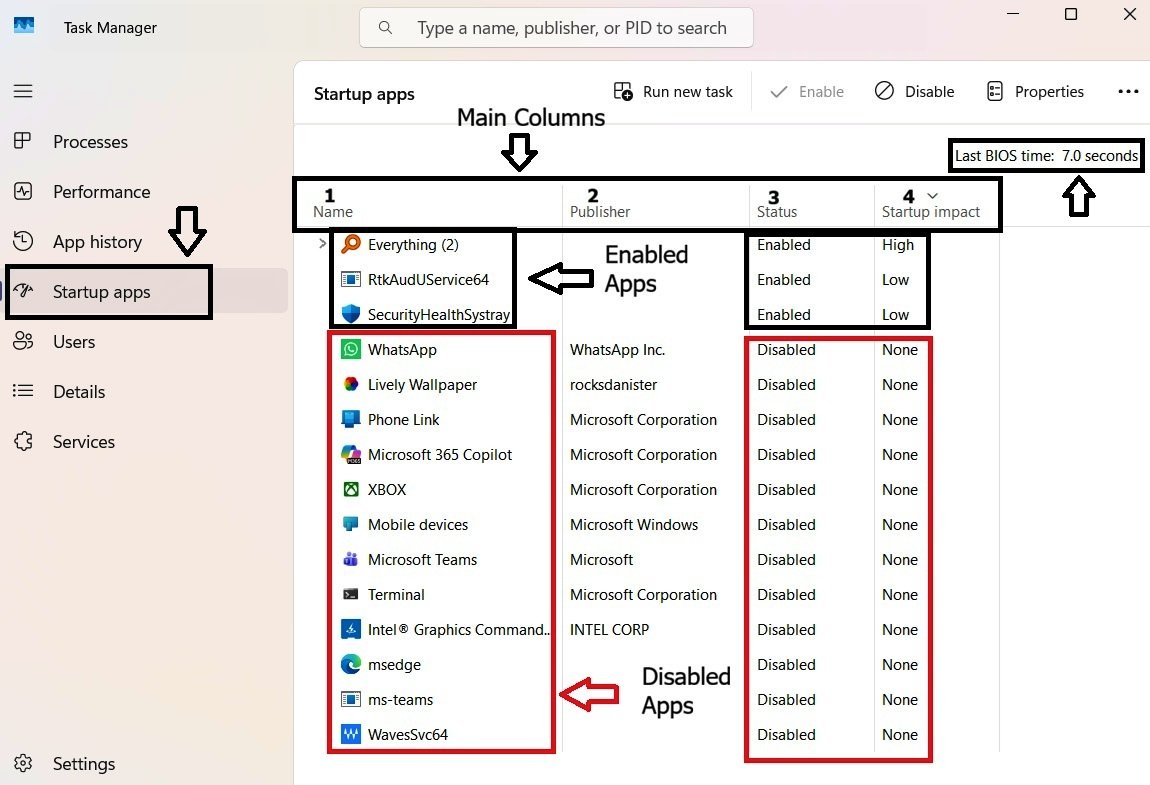
As you can see, there are four main columns, each holding specific information about every app in the list. Just above those columns, you’ll also notice a line reading something like “Last BIOS time: 7.0 seconds.” This is read-only information — there’s nothing to click or change here.
It simply tells you how long your motherboard’s firmware took to detect and initialize your hardware before Windows even started loading, not how long Windows itself took to boot.
Now, let’s go through each column one by one.
Name & Publisher
The Name column displays the application’s name, while the Publisher column identifies the company or organisation that created it.
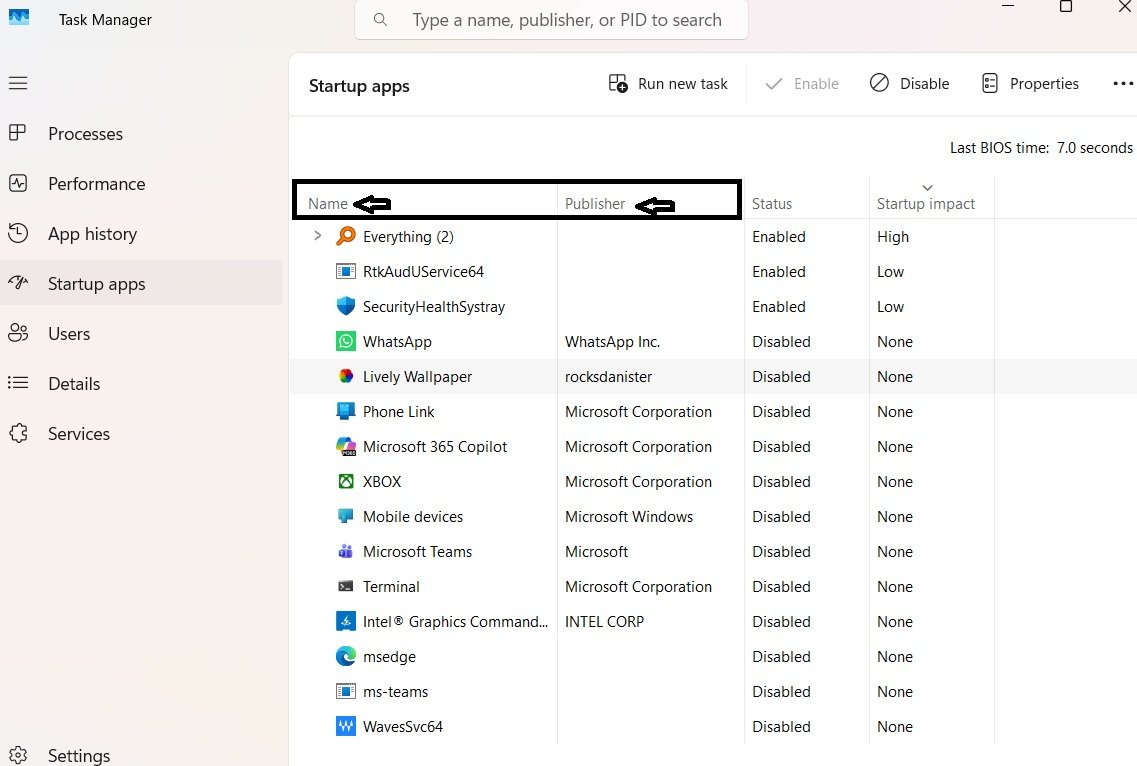
Together, these columns help you identify applications installed on your system. The publisher information can be particularly useful when you encounter an unfamiliar application name, as it often provides a clue about where the software came from.
Status
This column shows whether an app is Enabled or Disabled. Enabled means the app is allowed to launch automatically when you sign in; Disabled means it won’t.
One thing worth keeping in mind: enabling an app here doesn’t guarantee it opens a visible window the moment you sign in — as covered earlier, some startup apps run quietly in the background with no window at all, and some only show themselves once you actually start using them.
Startup Impact
The Startup Impact column estimates how much effect an application has on the Windows sign-in process.
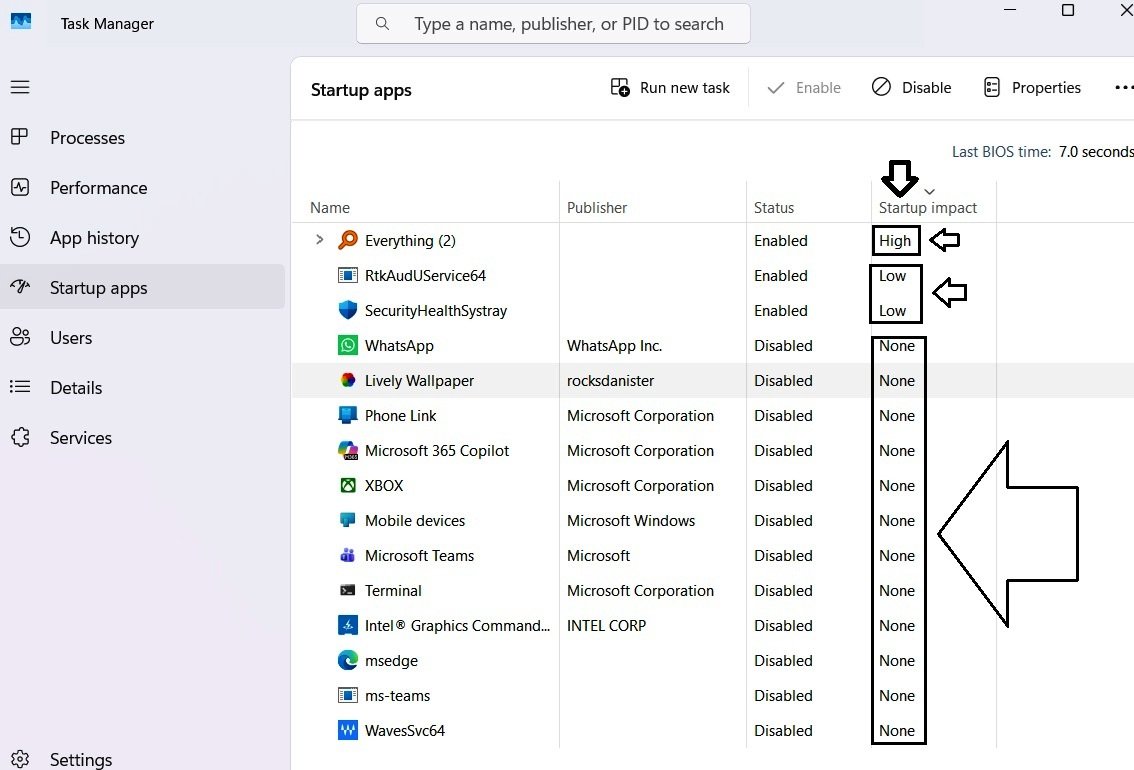
You may see values such as:
- High
- Medium
- Low
- Not measured
- None
Understanding these values correctly is important.
A High impact does not mean the application continuously consumes a high amount of CPU, memory, or other resources after Windows starts. Instead, it refers to the application’s effect during the startup process itself.
Similarly, a High impact rating does not automatically mean the application should be disabled. For example, security software or other important applications may legitimately have a higher startup impact because they need to load essential components during sign-in.
You may also notice that None is different from the other impact values.
- None usually indicates that the startup app is currently disabled.
- Not measured means Windows has not yet collected enough startup information to assign an impact rating.
- Low, Medium, and High are impact levels calculated by Windows after sufficient startup data has been collected.
For example, when you enable a startup app that was previously disabled, its impact may temporarily appear as Not measured. After Windows observes the application’s behaviour during future sign-ins, the value may later change to Low, Medium, or High.
We’ll see this behaviour again in the next section when we perform a practical exercise with startup apps.
Beyond These Four Columns
A couple of things worth keeping in mind before moving on: this list isn’t necessarily a complete picture of everything that can launch automatically with Windows — Services, Scheduled Tasks, and the Startup folder can all add startup items too, and those don’t always show up here.
And as already mentioned, remember that Startup Impact is an estimate, not a recommendation — Windows isn’t telling you what to turn off, just giving you the information to decide for yourself.
Let’s move on to actually enabling and disabling a startup app.
4.3 Enabling and Disabling a Startup App
Now for the practical part. Let’s first look at which startup apps are currently enabled or disabled on this PC.
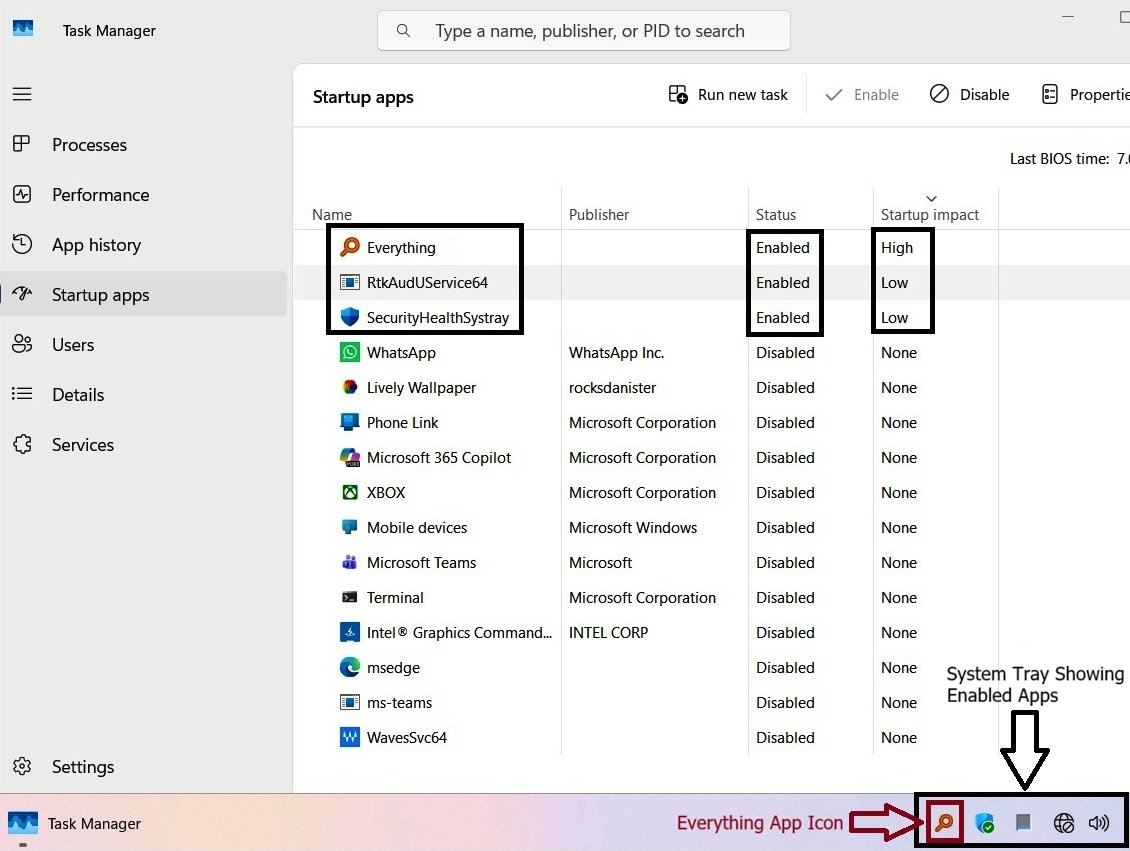
As you can see, this list has more than 15 apps, but only three are enabled — that’s simply a personal choice. I don’t like enabling a lot of startup apps; only a couple that came with Windows, plus one from a third party. This isn’t something I set once and forget, either — I change it from time to time, enabling or disabling apps as needed.
Of the three currently enabled, two are Windows-related, and one — “Everything” — is third-party. Let’s make a change: we’ll disable Everything and enable Copilot instead. To enable or disable a startup app, simply right-click the app and choose the appropriate option.
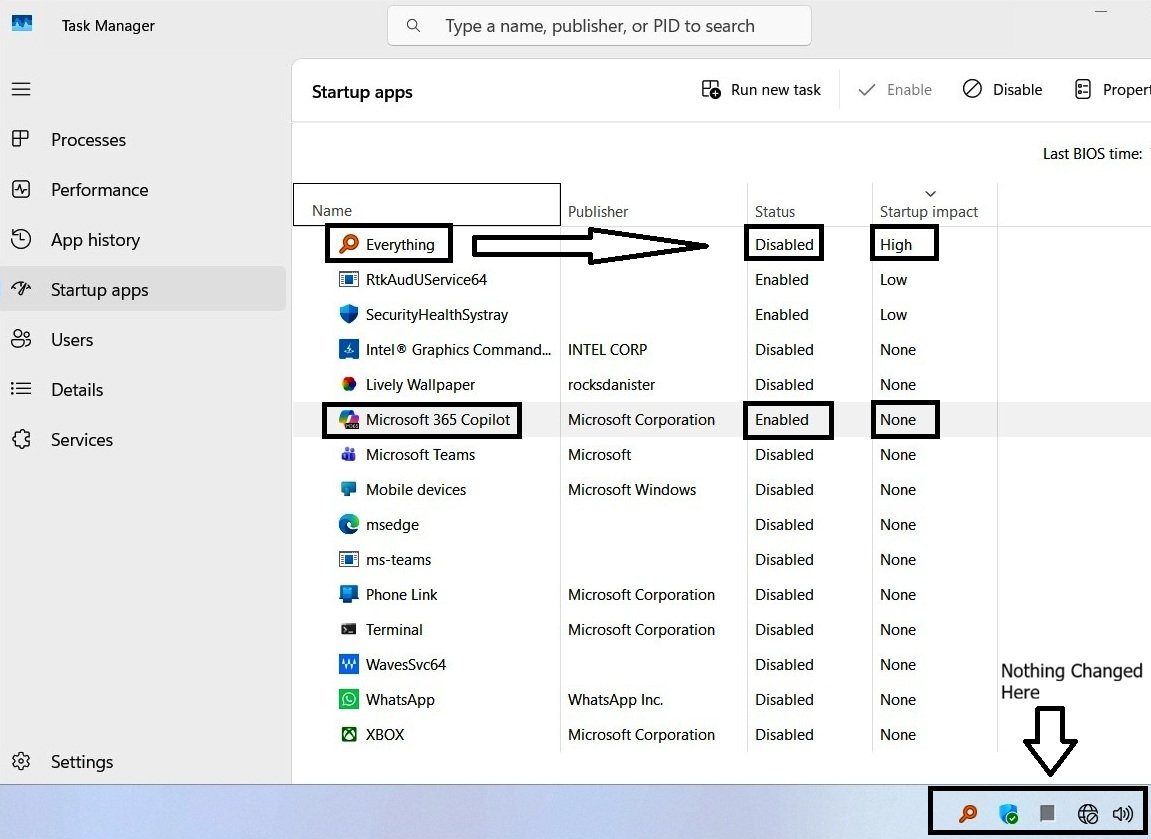
Both statuses have changed in the list — but notice the system tray hasn’t changed at all. Everything is still shown there, and Copilot isn’t. That’s because this change doesn’t take effect immediately; you need to restart your PC for it to apply.
One more thing worth noticing in this same screenshot: while the Status column changed for both apps, the Impact column didn’t — Everything still shows High, and Copilot still shows None. We’ll check whether that changes after a restart.
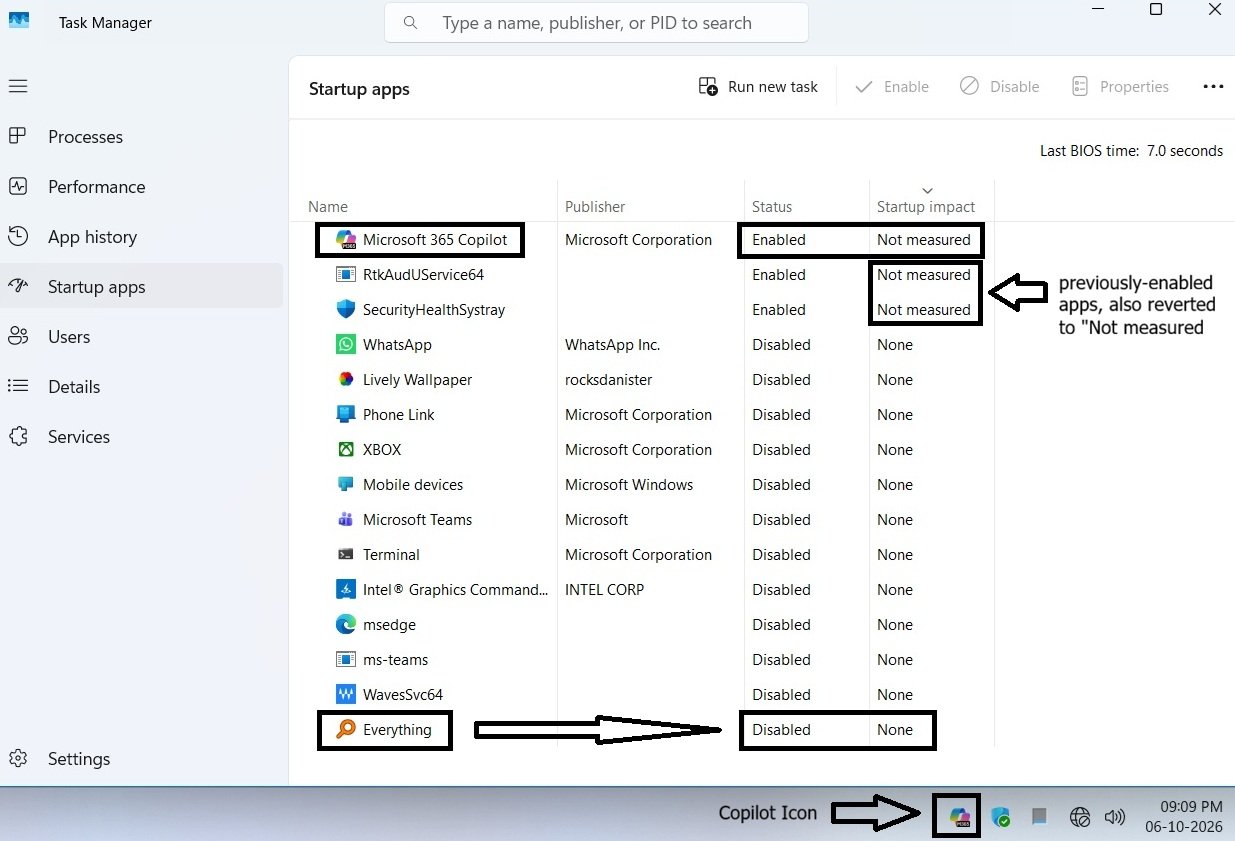
After restarting, a few things are confirmed. Copilot’s icon now appears in the tray, and Everything’s no longer does.
In the list, Everything now shows Disabled with None as its impact — as expected.
Copilot shows Enabled, with its impact listed as Not measured — which lines up with what we covered earlier: Windows needs time to collect data before it can assign an actual rating.
Here’s the genuinely interesting part, though: the previously-enabled apps — the ones that already had a Low rating before this change — also reverted to “Not measured,” even though their settings weren’t touched at all. I wasn’t able to find any official documentation explaining this specific behavior, so I won’t claim it’s universal — this is simply what I observed on my own machine through repeated testing, and your results may differ.
Since all the enabled apps now show “Not measured,” Windows should collect startup data for each of them and update the ratings based on their impact. How long this takes isn’t documented by Microsoft, so I can’t give you a confirmed number. In my testing, the ratings had still not returned after two days.
A “Not measured” rating only affects what the column displays. The app itself still launches at startup, as Copilot did here, so don’t worry if the rating takes a while or doesn’t come back quickly.
Right-Click Options
Let’s see some of the options available when you right-click any startup app in this list.
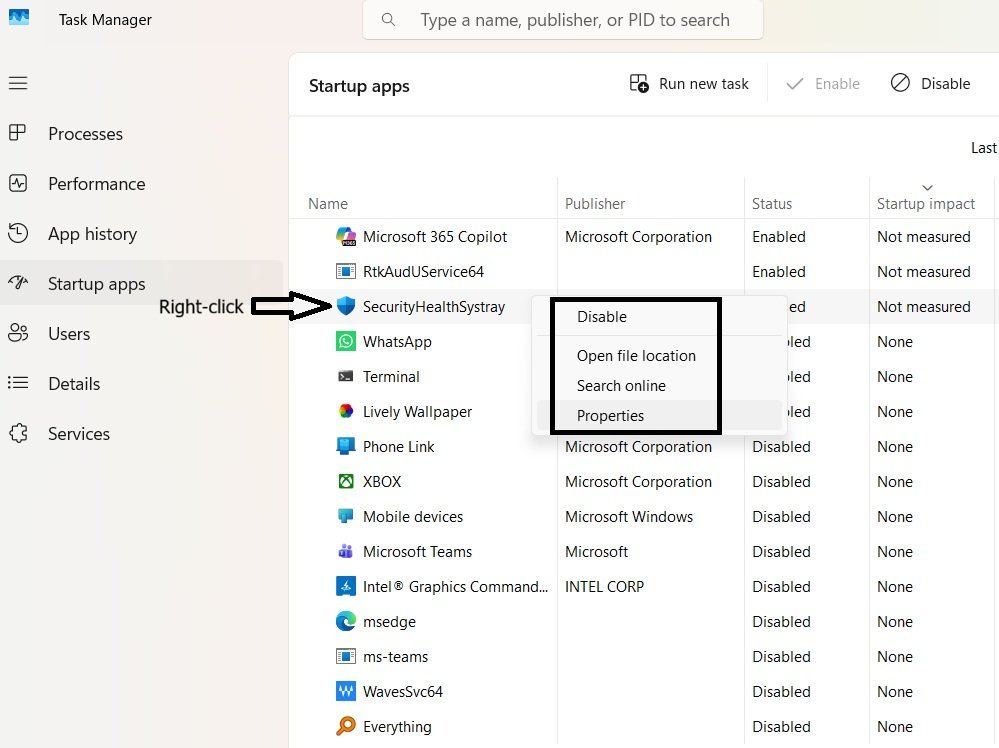
- Enable/Disable — toggles the app’s startup status, same as described above.
- Open file location — opens File Explorer to the folder where that app’s file is stored. This option isn’t available for every app, and will appear greyed out for some.
- Search online — runs a quick web search for that app’s name, useful if you don’t recognize it.
- Properties — opens that app’s file properties window.
That covers Startup Apps. Let’s move on to the next section — Users.
Note: Windows 11 also has a separate “Startup Apps” area inside Settings, which lets you manage the same apps with a few more advanced options than Task Manager offers — such as per-app permissions for camera, microphone, or storage access. That’s beyond what we’re covering here, but worth knowing it exists.
Part 5: Understanding Users in Task Manager
This section covers the Users tab — a small one, but genuinely useful in the right situation.
5.1 What Does the Users Tab Show?
Before looking at the tab itself, it’s worth understanding what this tab is actually for. The Users tab becomes useful specifically in a PC-sharing scenario — where multiple people sign in to the same computer. If someone leaves without signing out, or without closing the apps they had open, their session keeps running in the background and continues using your system’s resources. This tab is where you can spot that — confirming whether another signed-in user is the reason your PC feels slower than it should.
One important thing worth knowing upfront: getting the full value out of this tab — specifically, seeing what another user’s account is actually doing — requires that you’re signed in with an administrator account. A standard account can see that other users are signed in, but can’t expand their entries to view their individual processes and other options.
Let’s start by seeing what this tab actually shows.
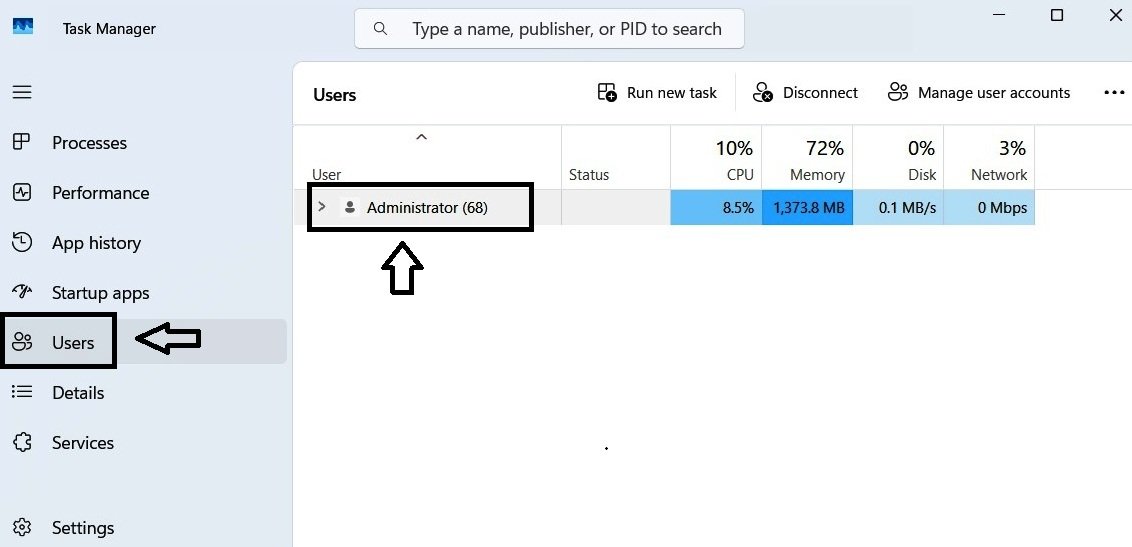
Since I’m signed in with the Administrator account and no one else is currently logged in, it only shows my own account’s information. For the sake of testing, I’ve created two additional accounts — User A and User B — both set up as standard accounts, meaning neither has administrator privileges. Let’s sign in to them and walk through how to read this list properly.
5.2 Reading the Users List
With User A and User B now signed in, let’s look at the Users list again.
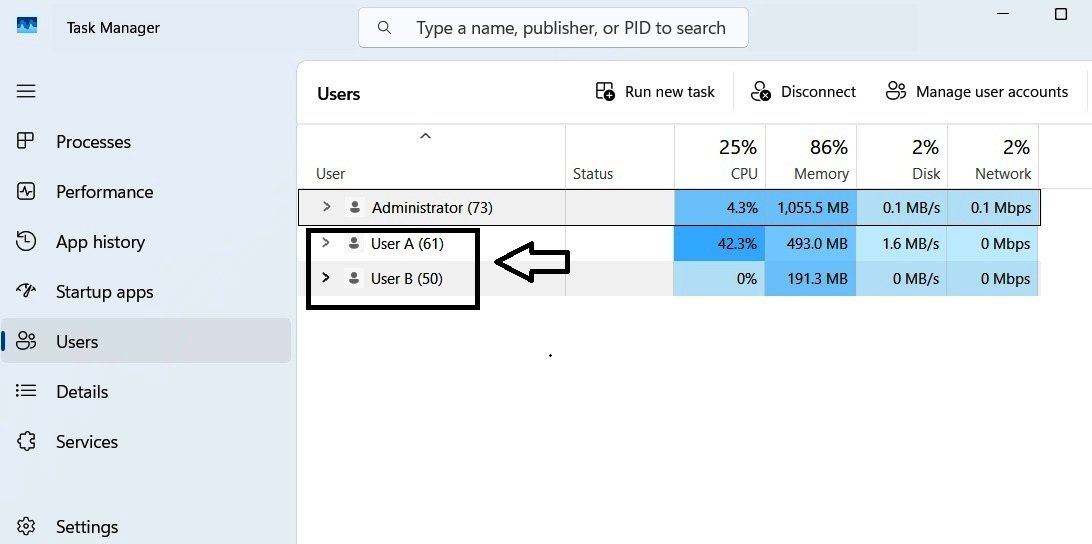
First, a key thing to understand: if you see accounts besides your own listed here, it means those users signed in and left without signing out — this list only shows accounts that are currently signed in.
You’ll also notice a number in parentheses next to each account. This represents the total number of processes running under that user — including everything they personally started, as well as anything Windows launched automatically on their behalf.
Across the top, you’ll see six columns: User, Status, CPU, Memory, Disk, and Network. Most of these are self-explanatory — the resource columns work the same way they do elsewhere in Task Manager. The one worth pausing on is Status, which we’ll come back to shortly.
Clicking the expand arrow next to a user reveals every process running under their account.
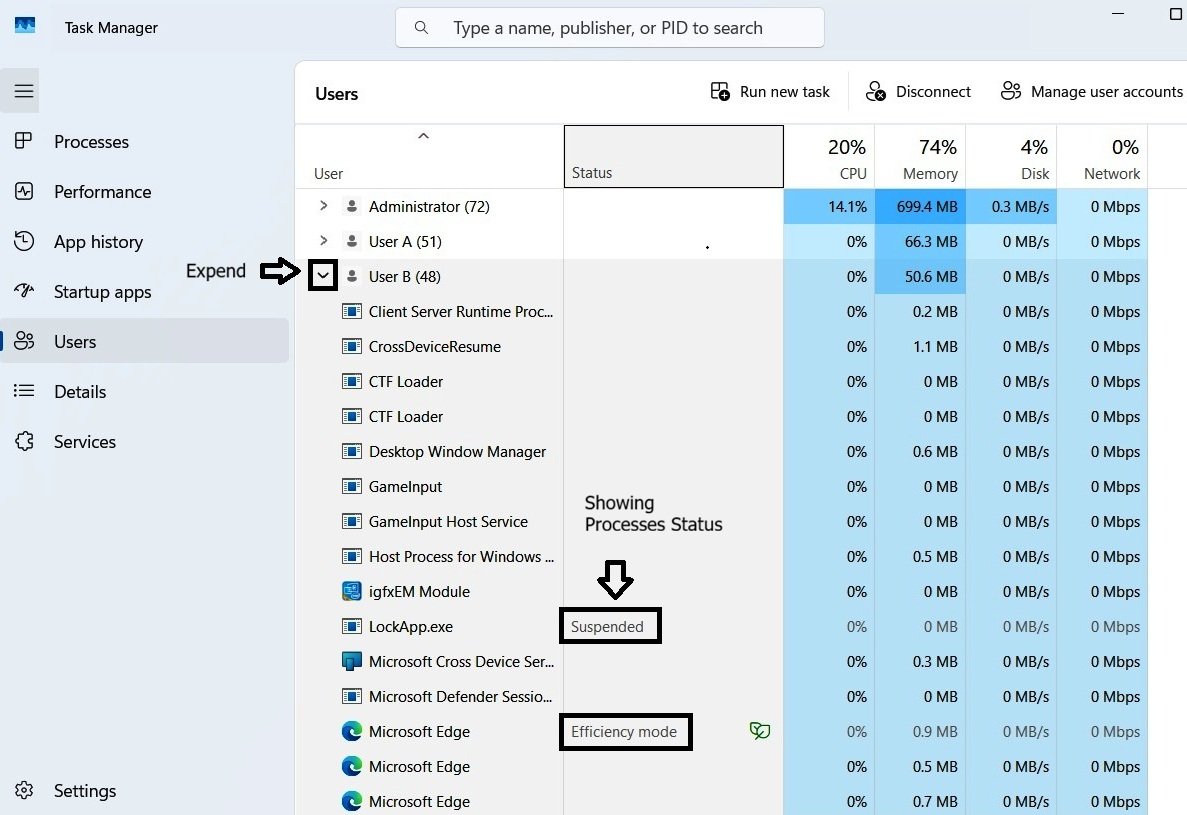
Expanding User B shows their complete process list — and you’ll notice some of these processes carry their own status labels, like Suspended or Efficiency Mode. This is what the Status column is actually telling you: the current state of that individual process, not just whether the user themselves is active.
Right-clicking a user reveals a full set of options:
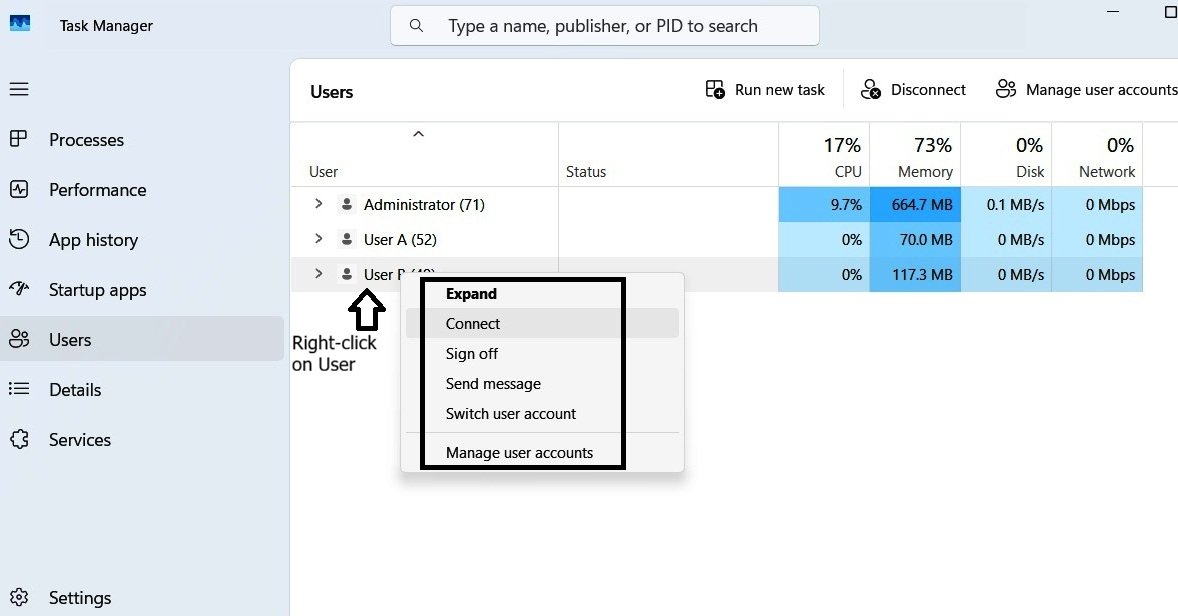
- Expand — same as clicking the expand arrow; shows all of that user’s running processes.
- Connect — signs you directly into that user’s account, similar to logging in on their behalf.
- Sign Off — signs that user out completely. Once this happens, their account is removed from this list, since it only shows currently signed-in users. Keep in mind: if that user has any unsaved work open, signing them off this way means they’ll lose it.
- Send Message — lets you send a message directly to that user, which will appear on their desktop the next time they sign in.
- Switch User Account — opens the sign-in screen with that specific user already selected.
- Manage User Account — opens the main account management settings in Control Panel.
Beside these, you’ll also find a separate Disconnect option at the top of the window.
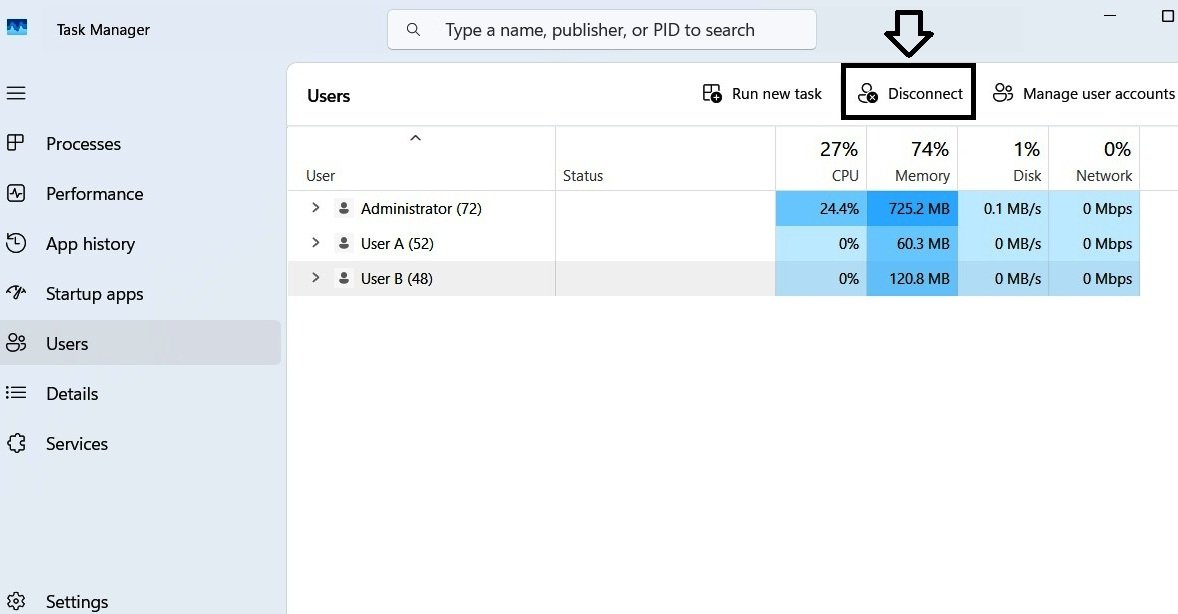
Disconnect vs. Sign Off
At first glance, Disconnect can look like it does the same thing as Sign Off — but it doesn’t. Disconnect leaves everything exactly as it was: all open apps and documents stay running, nothing closes, and the user’s session remains intact in the background. All it does is end the active connection to that session, which is why it drops back to the sign-in screen.
Sign Off, on the other hand, closes every open app and document and fully logs that user out — ending the session completely, not just stepping away from it.
This distinction matters most in shared or remote-access situations, where someone might need to step away from a session temporarily without losing their open work — Disconnect fits that case, while Sign Off is for when you genuinely want that user’s session ended.
Now, let’s move on to a few practical examples.
5.3 Managing a User Session
With the basics of the Users list covered, let’s walk through a few practical actions. Right-click User B to bring up the options list.
Expand
The first option is Expand. Clicking it reveals every process currently running under that user. This is especially useful when you don’t want to sign the user out entirely, but just want to end any specific app or processes they left running. For example, suppose User B left VLC Media Player open, and we only want to close that.
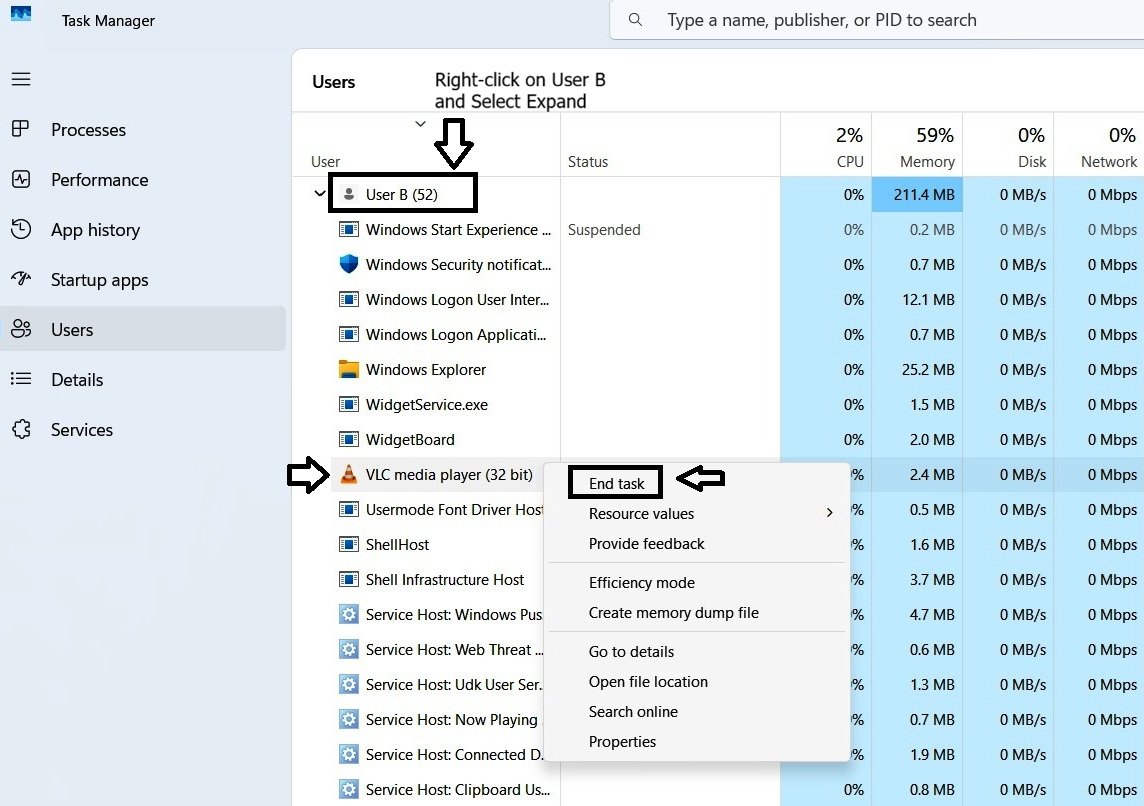
Right-click the VLC process and select End Task. This ends just that one process — a clean way to close a specific app on another user’s session without signing them out entirely.
Connect
Next — let’s try the second option, Connect.
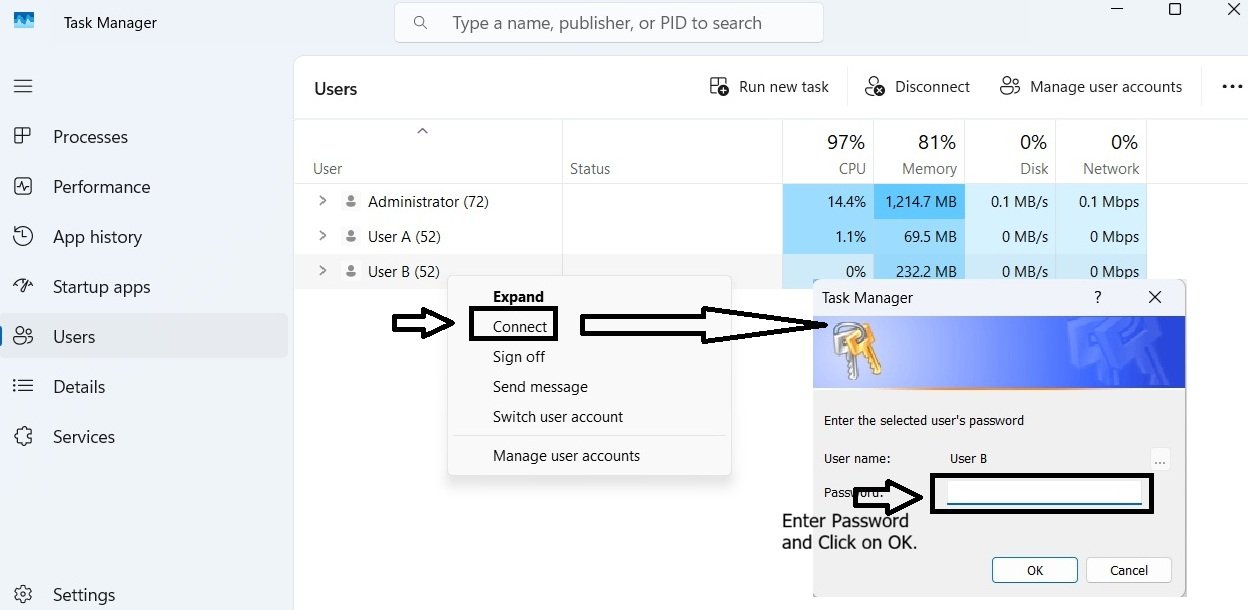
A small sign-in window opens, with User B already selected, asking for their password. Enter it, and you’ll be signed directly into User B’s account.
Note: if an account has no password set, attempting to connect to it will fail with an error — a password is required for this feature to work.
Here’s an interesting question worth testing: can User B use Connect to access the Administrator account? Let’s try it, signed in as User B this time.
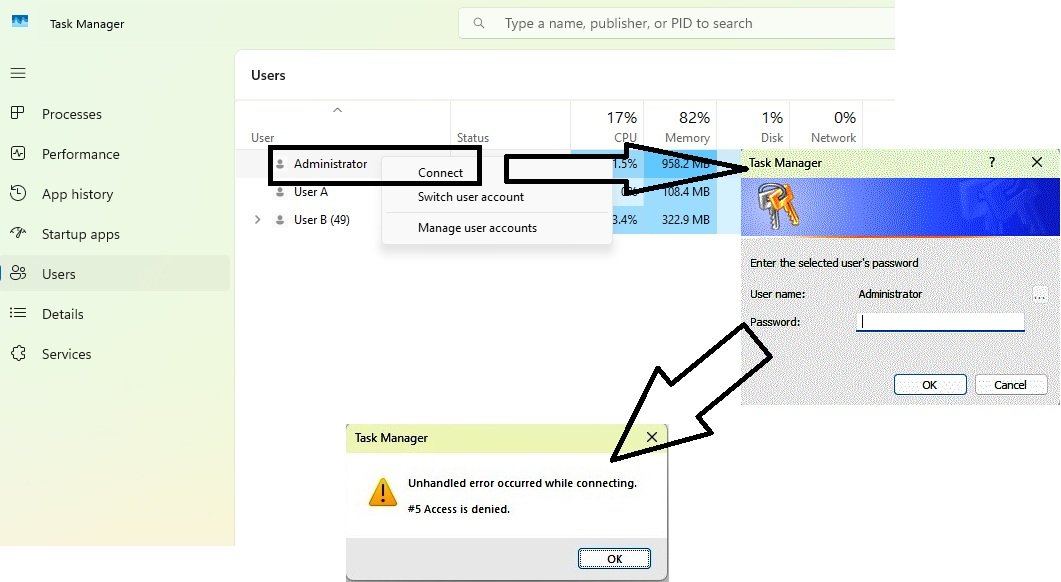
Even with the correct administrator password entered, the attempt ends in Access Denied. Standard accounts simply don’t have the permission to use this feature — this is expected, standard Windows behavior, not something specific to this PC.
You’ll also notice this restriction elsewhere: when signed in as a standard user, the Users tab only shows your own process count in parentheses — other users’ entries show no count at all, since you don’t have permission to see them. Right-clicking another user as a standard account confirms this further:
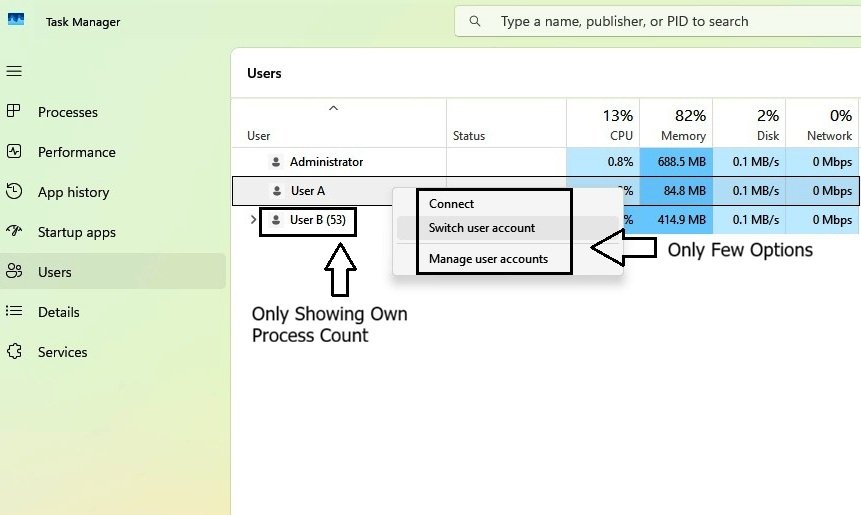
Only a handful of options remain available — a clear, visible example of the restrictions standard accounts operate under in this tab.
Sign Off
Back in the Administrator account, let’s continue with the right-click options. The next one is Sign Off — right-click User B and select it. A confirmation dialog appears.
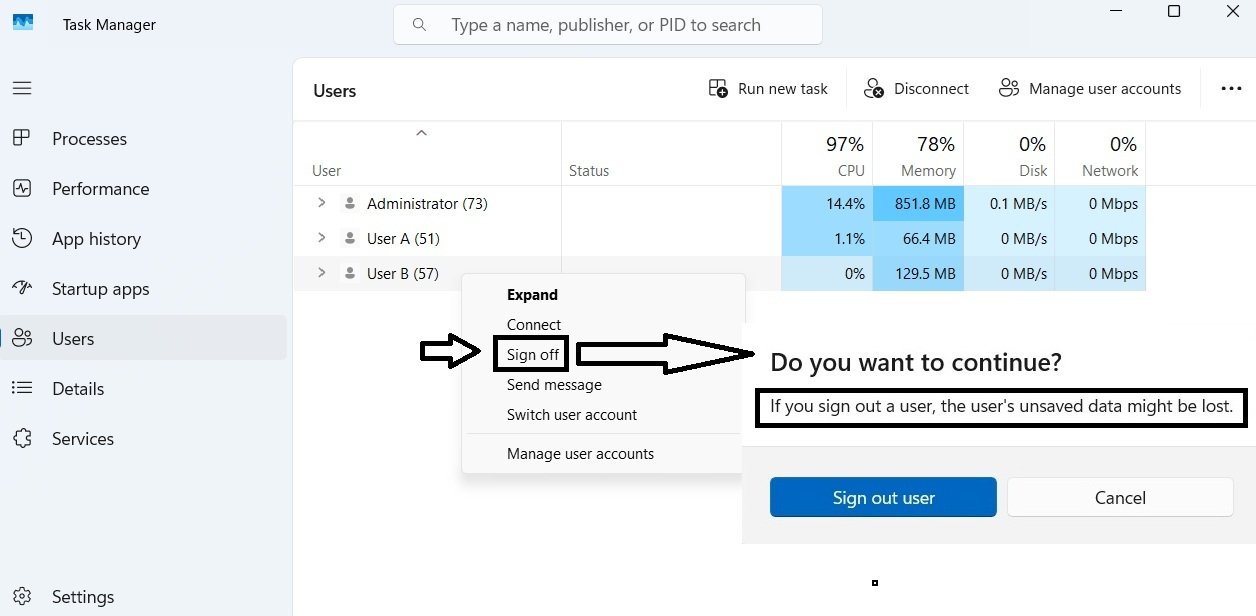
It asks you to confirm this, also showing a warning that the user’s unsaved data may be lost. Click Sign out user — after a few seconds, User B disappears from the list entirely.
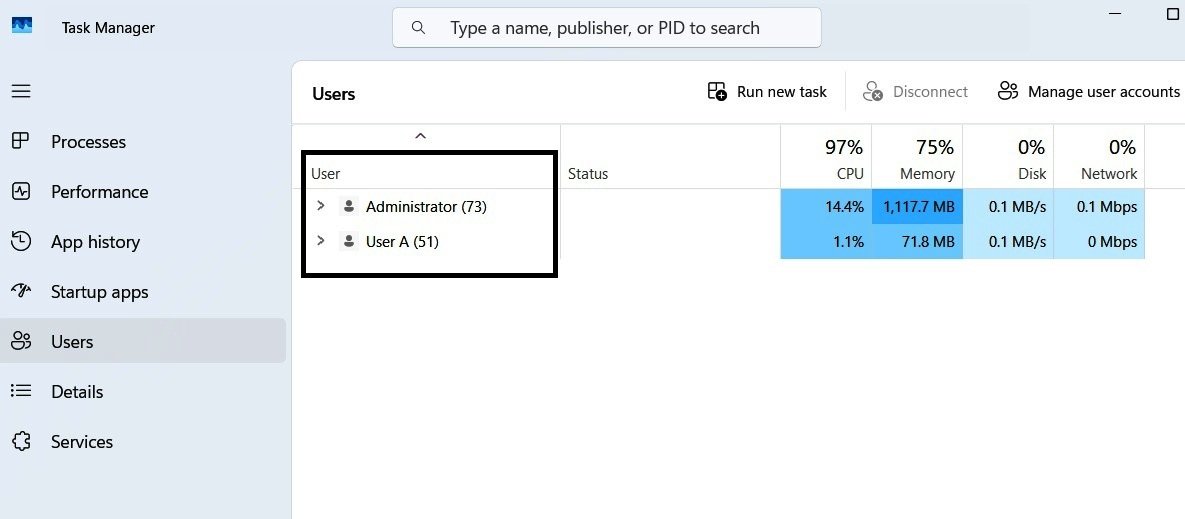
Since User B is now signed out, they no longer appear here — consistent with what we covered earlier: this list only shows currently signed-in users.
Send Message
Right-click User A and select Send Message. A message dialog box opens.
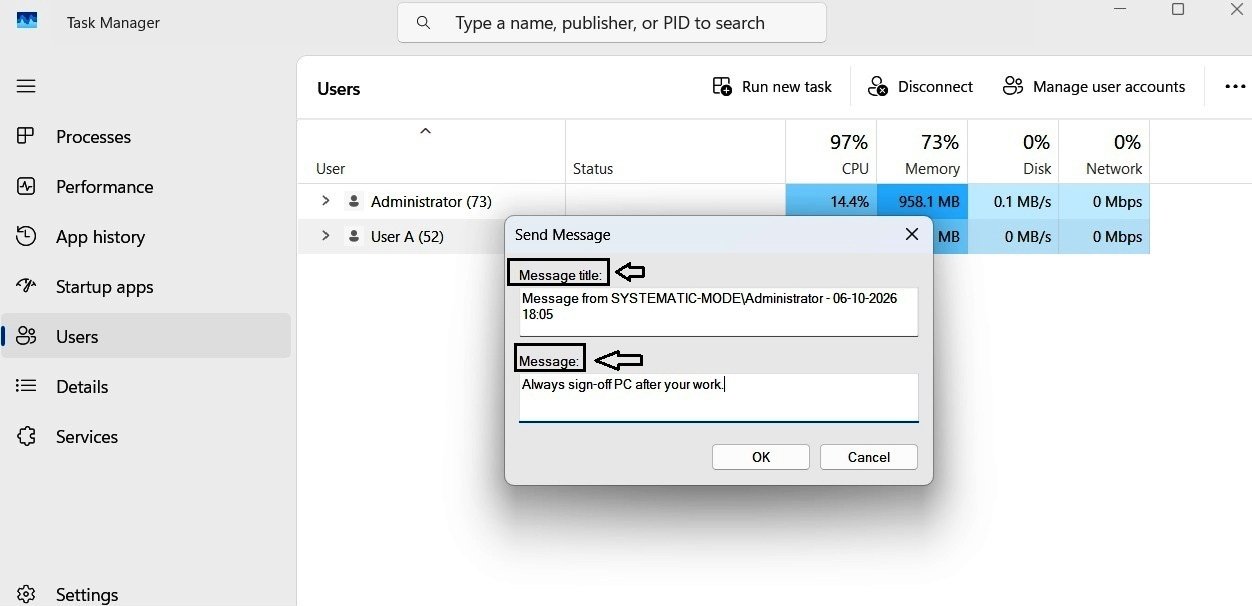
The title field is pre-filled with your account name, computer name, and the current date and time — though you can change this to anything you like. Below that, type your message. For this example: “Always sign off PC after your work.” Click OK. Now, signed in as User A, let’s check whether the message actually arrived.
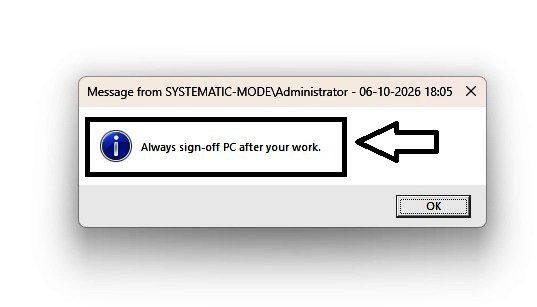
As expected, the message appears right away on User A’s screen.
Switch User Account
Back in the Administrator account. The next one is Switch User Account — Right-click User A and select this, and this opens the sign-in screen with User A already selected.
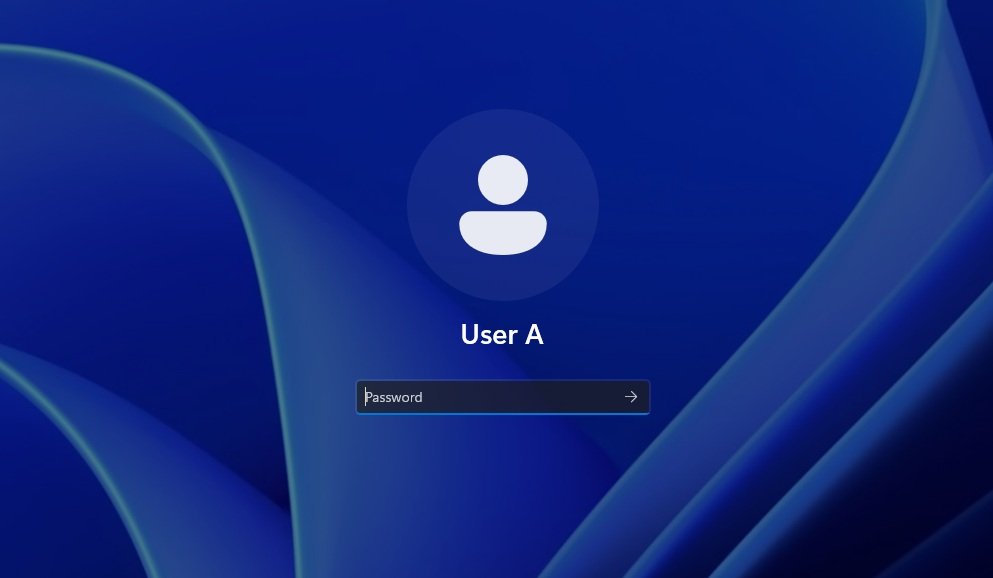
Enter the password to sign in to User A’s account from here.
The final option, Manage User Account, simply opens Control Panel’s main user accounts settings — nothing further to demonstrate.
So these are the options you’ll find when right-clicking another active user. But what happens if you right-click your own account instead?
Right-Click Options on Your Own Account
Right-clicking the Administrator account — your own, currently signed-in account — shows a different, shorter set of options.
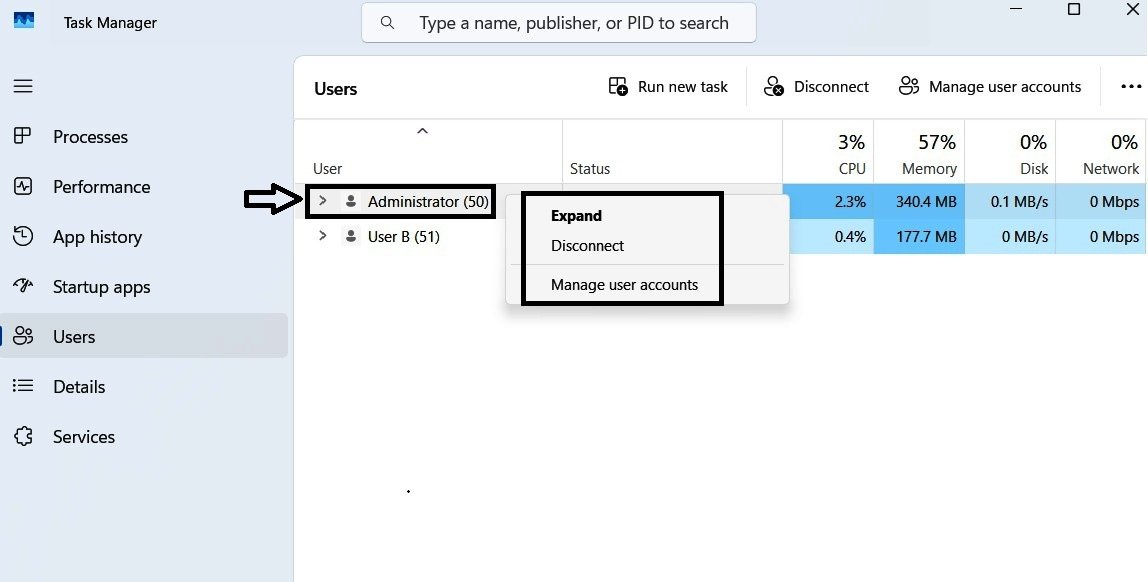
There are three options here. The first, Expand, works exactly as already covered. The third, Manage User Account, also works the same way as before, opening Control Panel’s user settings. The interesting one is the second: Disconnect.
Clicking it brings up a confirmation first: “Are you sure you want to disconnect the selected user?” Click Disconnect User to continue.
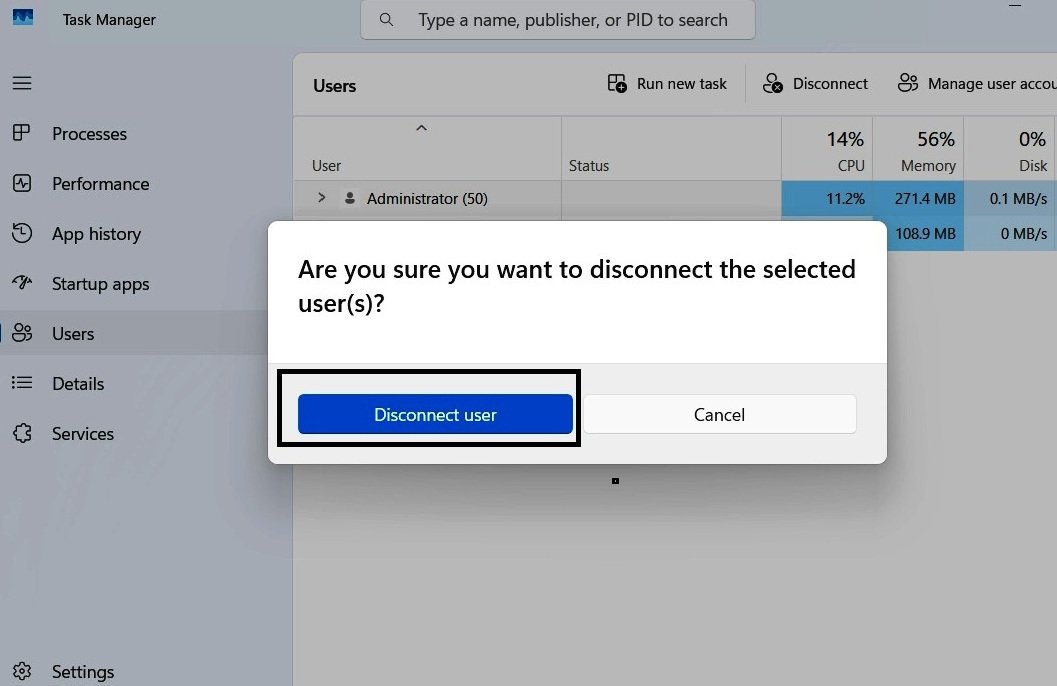
This immediately locks your session and brings up the sign-in screen, with your account already selected, asking for your password. This matches exactly what we covered earlier in the Disconnect vs. Sign Off explanation — entering your password and signing back in, you’ll find everything exactly as you left it. Compare that to Sign Off, where everything closes, and you’d have to start your apps and work again from scratch.
That completes Part 5 — Users. Let’s move on to Part 6.
Part 6: Understanding App History, Details, and Services in Task Manager
With the four main sections covered, let’s look at the remaining three — briefly, since none of them need the same depth as what we’ve already covered.
6.1 App History
The App History page records resource usage information over time rather than showing only what is happening right now.
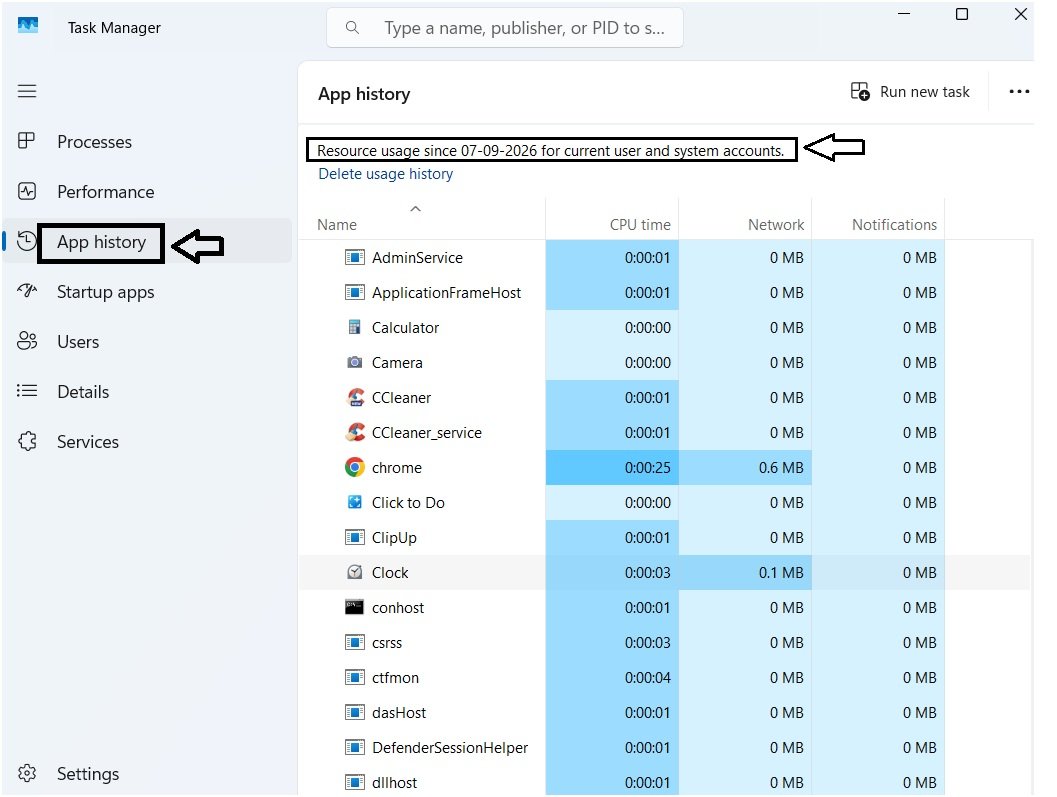
Unlike the Processes page, which shows current activity, App History focuses on historical resource usage. This allows you to see which applications have consumed resources over a longer period of time.
Task Manager displays the date from which it has been collecting resource-usage information. You can also use Delete Usage History to clear the collected statistics and start a new measurement period.
If you right-click an application in this list, you may see options such as:
- Search Online
- Properties
- Switch To
If available, the Switch To option allows you to directly switch to the running application associated with that entry.
For most everyday users, App History is simply a way to see which applications have been using resources over time rather than at the current moment.
6.2 Details
The Details page provides a more technical view of running processes.
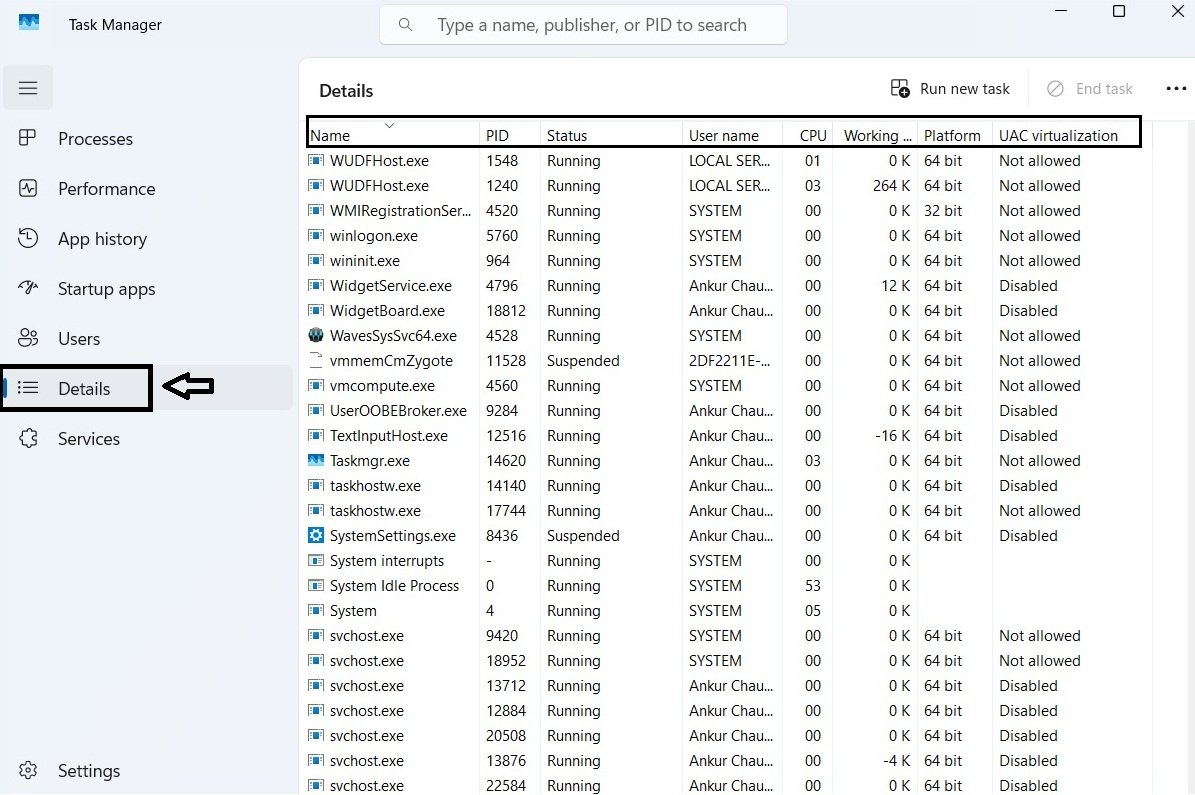
At first glance, the Details page may look similar to the Processes page, but its purpose is different.
While the Processes page presents applications in a more user-friendly way, the Details page focuses on individual processes and exposes additional technical information such as:
- Process names
- Process IDs (PID)
- User names
- Process status
- CPU usage
- Memory usage
This page is commonly used when a troubleshooting guide asks you to locate a specific process or Process ID (PID).
Earlier we learned how Task Manager often groups related processes together. The Details page removes much of that grouping and displays individual processes separately.
6.3 Services
The Services page displays Windows services and their current status.
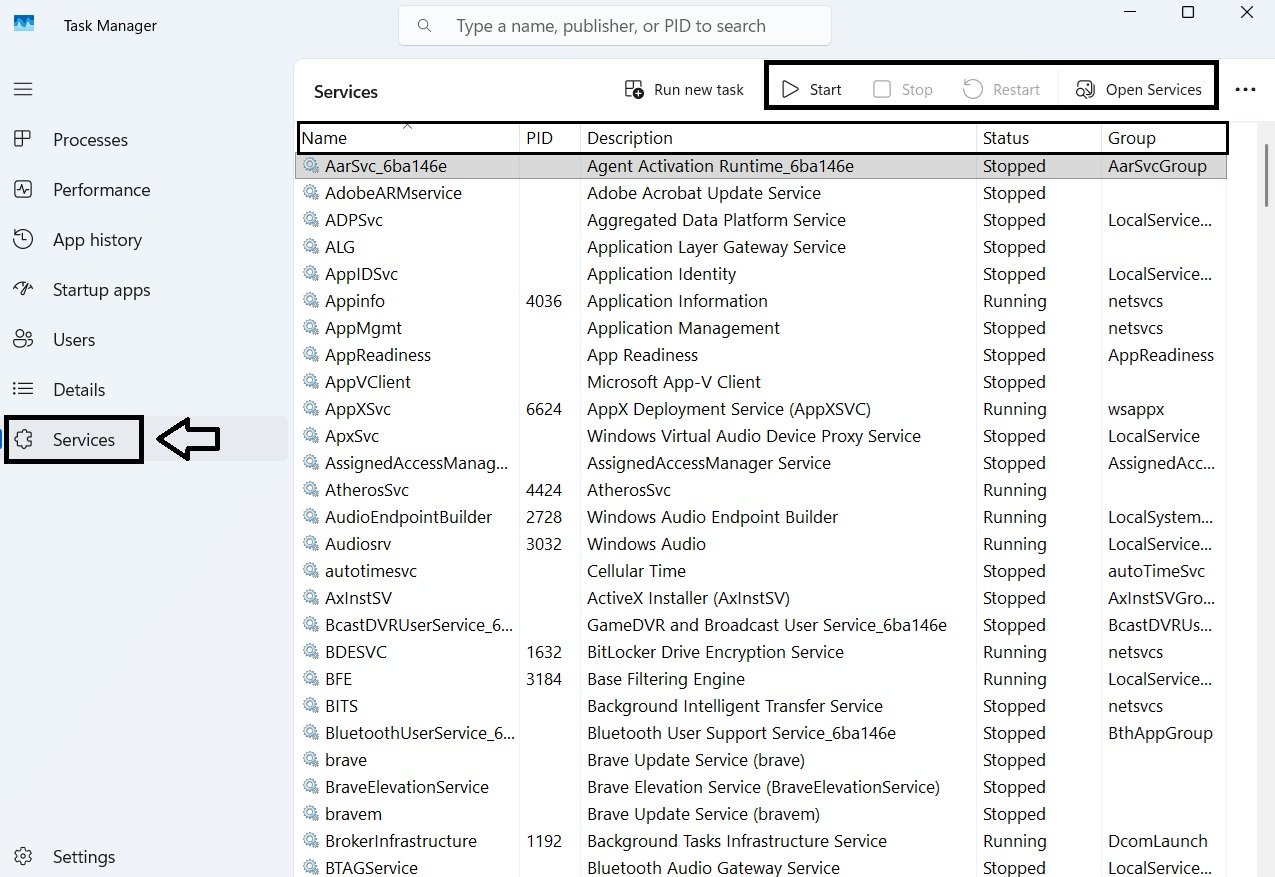
A service is a special type of program that runs in the background and helps Windows or installed software perform specific tasks.
Examples include services related to: Networking, printing, windows update and security.
The Services page allows you to see whether a service is currently running or stopped. If you right-click a service, you’ll typically find options such as:
- Start
- Stop
- Restart (where available)
- Search Online
- Go to Details
Although these options are available, you should be cautious when using them.
Warning: Many services are important parts of Windows or installed software. Starting or stopping services without understanding their purpose can cause applications or system features to stop working correctly.
For that reason, we’re not going to explore services in depth in this lesson. Understanding Windows services properly would require a dedicated lesson of its own.
With that, we’ve now covered all seven major sections of Task Manager. The only section remaining is Settings, which controls how Task Manager itself behaves and displays information. Let’s take a look at those options next.
Part 7: Task Manager Settings — Appearance and Behavior
Settings is found at the bottom-left of Task Manager’s sidebar. This is where you control Task Manager’s own appearance and behavior — not anything about your PC itself, just how this tool looks and acts.
7.1 Appearance
When you open Settings, the first group of options is Appearance.
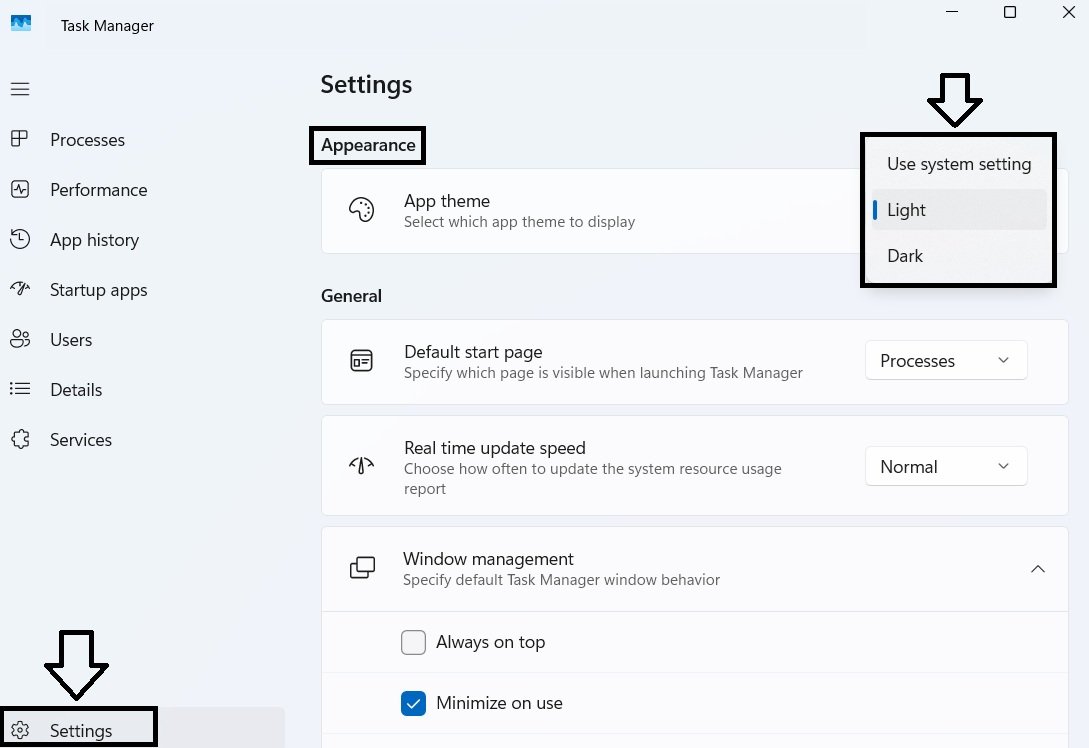
Three appearance modes are available:
- Use System Setting: Task Manager follows the current Windows theme.
- Light: Uses a light colour theme regardless of the Windows theme.
- Dark: Uses a dark colour theme regardless of the Windows theme.
This setting affects only Task Manager and allows you to choose the appearance you prefer.
7.2 General Settings
Below the Appearance section, you’ll find several general settings that control how Task Manager behaves.
The first option is Default Start Page. As you’ll recall, Task Manager opens on the Processes tab by default — this is where you can change that.
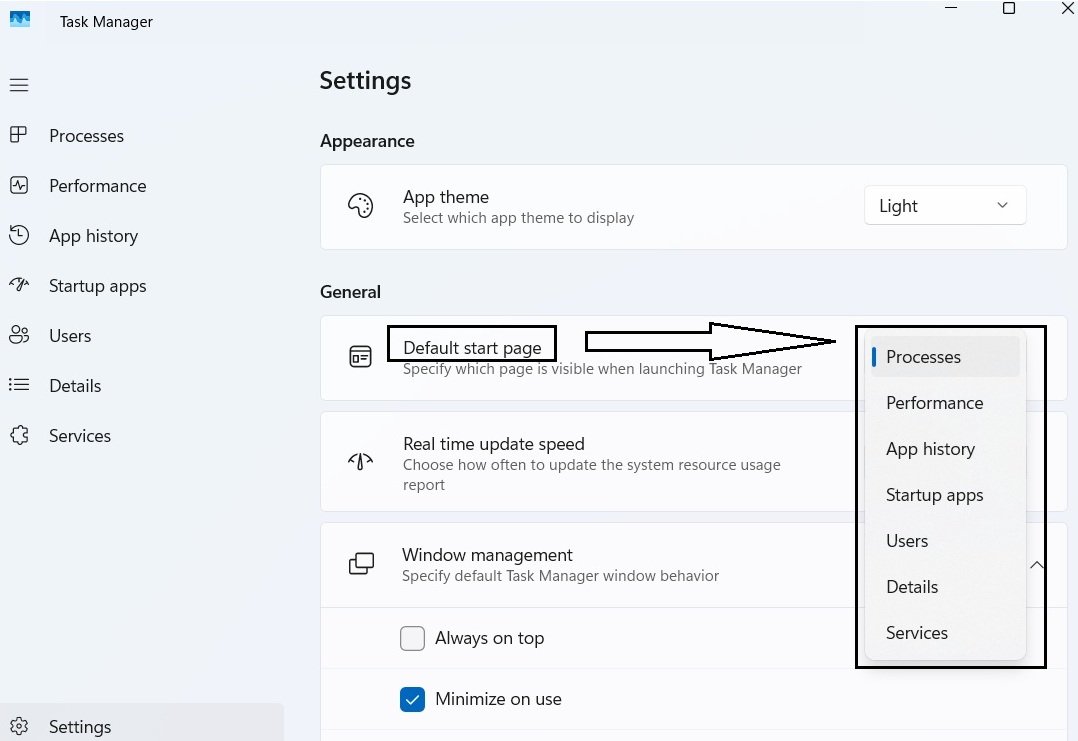
All seven tabs are listed here — whichever one you select will be the tab Task Manager opens to the next time you launch it.
The second option is Real-Time Update Speed, with four choices: High, Normal, Low, and Paused.
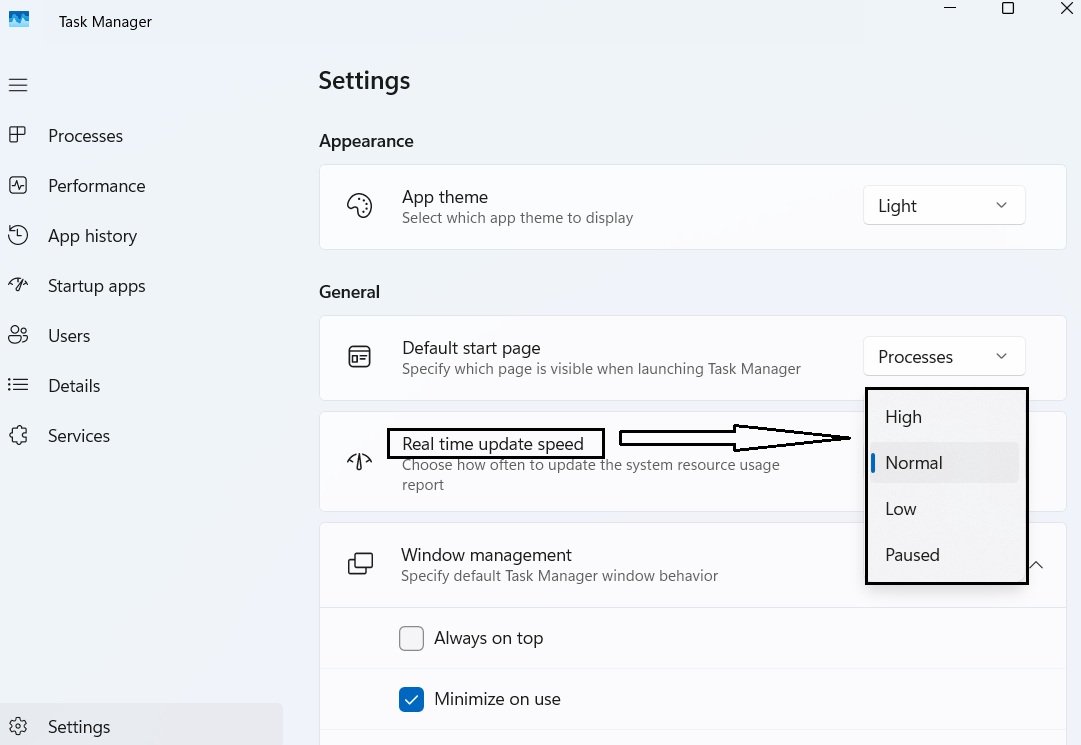
Normal is selected by default. Choosing High makes every graph and figure across Task Manager refresh more frequently; Low slows that refresh rate down; and Paused stops live updates altogether, useful if you want to freeze a moment in time and look at it without the numbers shifting under you.
The third option is Window Management, with three settings:
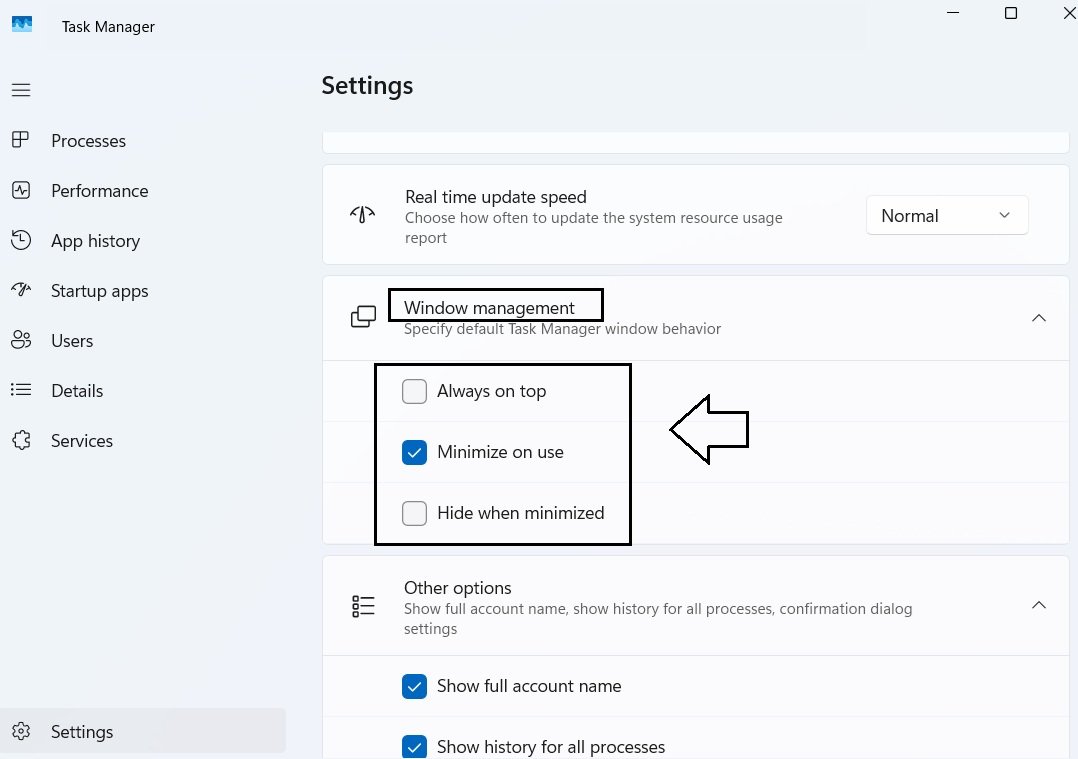
- Always on Top — keeps Task Manager’s window above every other open window on your screen.
- Minimize on Use — When enabled, Task Manager automatically minimizes itself after certain actions, such as switching to another application from within Task Manager.
- Hide When Minimized — when enabled, minimizing Task Manager removes its icon from the taskbar entirely, showing only a small icon in the system tray instead — the same area where startup apps often appear. Double-clicking that tray icon brings Task Manager back.
A few more options follow:
Task Manager also includes a few additional settings.
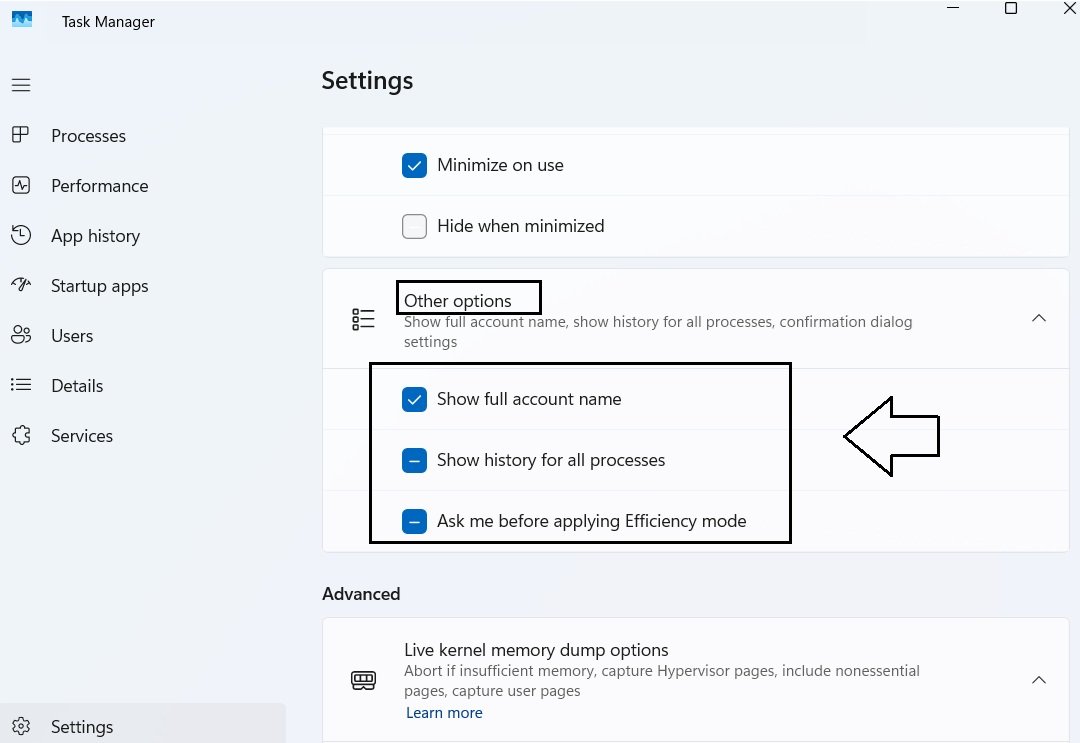
- Show Full Account Name — when enabled, the Users tab displays your full account name instead of a shortened version.
- Show History for All Processes — this one matters if App History’s tab looks sparse or empty; enabling it tells Windows to track and display usage history for all processes, not just a limited set.
- Ask Me Before Applying Efficiency Mode — when enabled, Task Manager will show a confirmation prompt before turning Efficiency Mode on for a process — exactly what we saw happen earlier when enabling it on Excel.
7.3 Advanced and Reset Default
Near the bottom of the Settings page, you’ll find the Advanced section. Most of these options are intended for more specialised scenarios and are generally not something everyday users need to modify.
At the bottom of the page, you’ll also find a Reset to Default button.
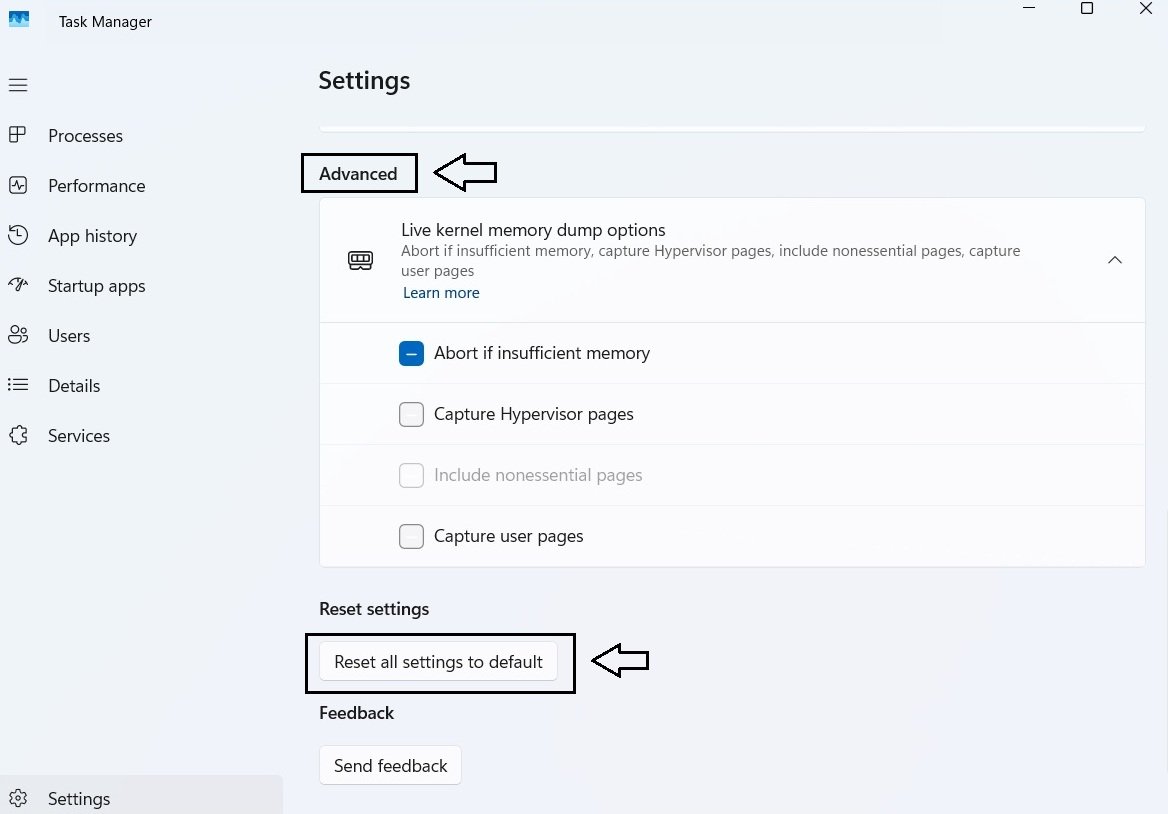
If you’ve changed multiple settings and want to return Task Manager to its original configuration, selecting Reset to Default restores the default settings.
You’ll also find a Feedback option, which allows you to send feedback to Microsoft regarding Task Manager.
With that, this lesson is complete. Now, let’s move on to a quick summary of everything we’ve covered.
Summary & Conclusion
Lesson Summary
- Task Manager vs. Taskbar: The Taskbar is the always-visible bar you use to open and switch apps. Task Manager is a separate utility you open when you want to see and manage what’s running.
- What Is Task Manager (Part 1): It’s a built-in tool for monitoring and managing your PC’s activity. You can open it in several ways, and
taskmgrthrough Run works across nearly every Windows version. - Processes (Part 2): Processes are grouped into Apps, Background processes, and Windows processes. Grouping depends on an app’s AppUserModelID, and the number in brackets counts processes, not open files. You can end a stuck task, but unsaved work is lost.
- Performance (Part 3): This tab shows your hardware’s live activity across CPU, memory, disk, network, and GPU. A short spike is normal, sustained high usage is worth investigating, and the graph layouts can be changed.
- Startup Apps (Part 4): This tab lists the apps that launch when you sign in. Status shows whether each is enabled, and Startup Impact estimates its effect on sign-in time. “None” means disabled, and “Not measured” means Windows hasn’t rated it yet.
- Users (Part 5): This tab shows everyone signed in. With an administrator account you can expand a user’s processes, sign them off, send them a message, or connect to their session. Disconnect keeps a session running, while Sign Off closes it.
- App History, Details, and Services (Part 6): These are the three more specialized tabs. App History tracks usage over time, Details gives the technical process view, and Services lists Windows services.
- Settings (Part 7): This is where you change how Task Manager itself looks and behaves, including its theme, default tab, update speed, and window behavior. A Reset to Default button undoes any changes.
Conclusion
We started this lesson with Task Manager as a kill switch for frozen programs, and it turned out to be much more than that. Each tab shows a different side of what your PC is doing, from the apps in front of you to what quietly starts in the background. You don’t need to memorize every column or setting. What matters is knowing where to look and understanding what you’re seeing before you act on it. The next time something feels off on your PC, you’ll know which tab to open first.
What’s Next
If you remember the Startup Apps section, we opened msconfig for a moment and found its Startup tab pointing us to Task Manager. That raises a question: if startup management moved, what is msconfig actually for today?
That’s what we’ll find out in the next lesson, where we’ll look at Windows System Configuration and what this long-standing utility does now. It’s often mistaken for a system information tool, but its real purpose is quite different.
Stay tuned and we’ll see you in the next lesson on SystematicMode.com!